What is Customer Churn? A Data Scientist’s Guide to Calculation and Types
Why Should Businesses Care About Customer Churn? Understanding Its Impact
Customer churn, also known as customer attrition, is a critical metric for any business, regardless of industry. Simply put, customer churn refers to the rate at which customers stop doing business with an entity. While it sounds straightforward, its implications for revenue, growth, and brand perception are profound. For a CFO, understanding and mitigating churn isn’t just about saving customers; it’s about turning churn prediction into guaranteed Q4 revenue, a topic we explore in depth in our CFO’s Playbook on Churn Prediction. High churn erodes market share, increases customer acquisition costs, and can signal underlying issues in product-market fit or customer satisfaction. Conversely, even a small reduction in churn can lead to significant increases in profitability, making it a cornerstone of sustainable business growth.
- What is Customer Churn? A Data Scientist's Guide to Calculation and Types
- Why Should Businesses Care About Customer Churn? Understanding Its Impact
- How Do You Calculate Customer Churn Rate? The Essential Formulas
- What Are the Different Types of Customer Churn? Voluntary vs. Involuntary & More
- How Do Data Scientists Identify At-Risk Customers? The Role of Features
- What are Customer Churn Models? An Introduction to Predictive Techniques
- How Can Businesses Use Churn Prediction for Strategic Advantage? Beyond Just Retention
- What are the Common Challenges in Churn Prediction? Data Quality & Bias
- Conclusion: Embracing Churn Analytics for Sustainable Growth
How Do You Calculate Customer Churn Rate? The Essential Formulas
Calculating customer churn rate is fundamental to tracking its impact and informing strategic decisions. While the basic concept remains consistent, the specifics can vary based on your business model (e.g., subscription vs. non-subscription).
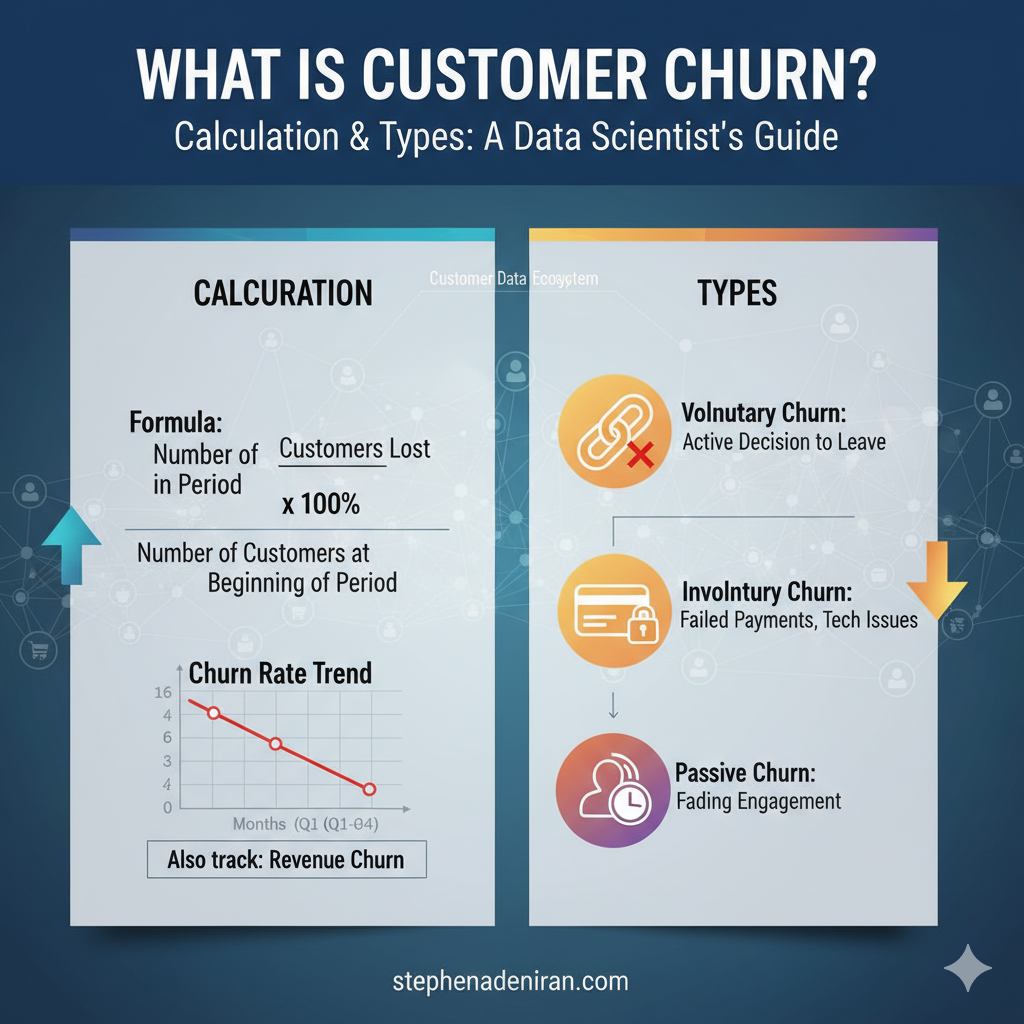
The Basic Customer Churn Rate Formula:
$$
\text{Churn Rate} = \frac{\text{Number of Customers Lost in Period}}{\text{Number of Customers at Beginning of Period}} \times 100\%
$$
Example: If you started the month with 1,000 customers and lost 50, your churn rate is $(50 / 1,000) \times 100\% = 5\%$.
For Subscription-Based Businesses (SaaS, Streaming, etc.):
In these models, it’s often more insightful to track revenue churn in addition to customer churn.
- Customer Churn Rate: $$\text{Customer Churn Rate} = \frac{\text{Number of Subscribers Lost in Period}}{\text{Number of Subscribers at Beginning of Period}} \times 100\%$$
- Revenue Churn Rate (MRR Churn): $$\text{Revenue Churn Rate} = \frac{\text{MRR Lost from Churned Customers}}{\text{MRR at Beginning of Period}} \times 100\%$$ Where MRR = Monthly Recurring Revenue
Key Considerations for Calculation:
- Time Period: Define your period consistently (monthly, quarterly, annually).
- New Customers: Typically, new customers acquired during the period are excluded from the denominator to avoid skewing the rate.
- Active Customers: Ensure you’re only counting truly “active” customers to avoid understating churn.
What Are the Different Types of Customer Churn? Voluntary vs. Involuntary & More
Churn isn’t a monolithic problem; it manifests in various forms, each requiring a distinct approach. Understanding these types is crucial for effective mitigation strategies.
- Voluntary Churn: This occurs when customers actively decide to stop using your service. It’s often driven by factors like:
- Poor customer experience
- Better alternatives from competitors
- Lack of perceived value or features
- Changes in customer needs or budget
- This is the type of churn where Predictive Analytics Services can be most impactful, identifying early warning signs before a customer explicitly leaves.
- Involuntary Churn (Passive Churn): This happens when customers churn due to circumstances beyond their direct intention to leave. Common causes include:
- Expired credit cards or failed payments
- Technical glitches
- Forgotten passwords or login issues
- These can often be addressed through proactive dunning management systems and improved user experience flows.
- Active Churn: Customers explicitly cancel or terminate their relationship. This is usually the most straightforward to identify.
- Passive Churn: Customers fade away, stop engaging, or simply don’t renew without formally canceling. This is particularly relevant for non-subscription businesses or services where engagement is key. Detecting passive churn often requires sophisticated Customer Analytics Services to identify declining usage patterns.
- Gross Churn vs. Net Churn:
- Gross Churn: The total loss of revenue or customers, without considering new acquisitions or upgrades.
- Net Churn: Gross churn minus any revenue gained from upgrades or new customers during the same period. A negative net churn is ideal, indicating that expansion revenue from existing customers (or new customer acquisition) is outpacing losses.
How Do Data Scientists Identify At-Risk Customers? The Role of Features
Identifying customers at risk of churning is where a data scientist’s expertise truly shines. It involves moving beyond simple churn rates to understand the why and who. This process typically involves feature engineering and selection.
Common Data Features Used in Churn Prediction:
- Demographic Data: Age, location, income (where applicable and ethically gathered).
- Usage Data:
- Login frequency
- Time spent on platform/product
- Feature adoption rates
- Number of transactions
- Data volume consumed
- Engagement Data:
- Customer support interactions (number, sentiment, resolution time)
- Email open rates, click-through rates
- App notifications opened
- Social media interactions
- Billing & Subscription Data:
- Contract length
- Payment history (late payments, payment failures)
- Pricing tier
- Promotions or discounts applied
- Survey Data/Feedback: NPS scores, satisfaction surveys.
- Product-Specific Metrics: Tailored to your specific service or product (e.g., number of projects created in a SaaS tool, items viewed in e-commerce).
The goal is to transform raw data into meaningful features that can feed into customer churn models, which we’ll discuss next.
What are Customer Churn Models? An Introduction to Predictive Techniques
Customer churn models are statistical and machine learning algorithms designed to predict which customers are most likely to churn in the future. These models are the backbone of a proactive churn retention strategy. At Stephen Consulting, our AI & Machine Learning Services specialize in developing and deploying these advanced models.
Popular Types of Churn Prediction Models:
- Logistic Regression: A fundamental statistical model that estimates the probability of a binary outcome (churn/no churn) based on one or more predictor variables. It’s interpretable and a good starting point.
- Decision Trees & Random Forests:
- Decision Trees: Flowchart-like structures where each internal node represents a “test” on an attribute, each branch represents the outcome of the test, and each leaf node represents a class label (churn/no churn).
- Random Forests: An ensemble method that builds multiple decision trees and merges their predictions to improve accuracy and control overfitting. They are highly effective for churn prediction due to their ability to handle complex interactions between features.
- Gradient Boosting Machines (e.g., XGBoost, LightGBM): Another powerful ensemble technique that builds trees sequentially, with each new tree correcting errors made by previous ones. These models often achieve state-of-the-art performance in churn prediction.
- Support Vector Machines (SVMs): Algorithms that find the optimal hyperplane that separates data points into different classes (churners/non-churners) in a high-dimensional space.
- Neural Networks (Deep Learning): While often requiring more data, deep learning models can capture intricate, non-linear patterns in customer behavior data, especially useful for large datasets with many features.
- Survival Analysis: A statistical method often used in medical research to model time-to-event data (e.g., time until a patient relapses). In churn prediction, it models the “time until a customer churns,” providing insights into customer lifetime and risk over time.
Choosing the right model depends on data availability, model interpretability needs, and the specific business problem. For a deeper dive into these frameworks, refer to our upcoming post on “The Best Customer Churn Models“.
How Can Businesses Use Churn Prediction for Strategic Advantage? Beyond Just Retention
Identifying at-risk customers is just the first step. The true value lies in how businesses leverage these insights. This is where Business Intelligence & Reporting Services become crucial, transforming raw model outputs into actionable dashboards and KPIs.
Strategic Applications of Churn Prediction:
- Targeted Retention Campaigns: Instead of generic offers, provide personalized incentives (discounts, new features, dedicated support) to customers identified as high-risk.
- Proactive Customer Support: Reach out to at-risk customers with personalized assistance before they even consider leaving.
- Product Improvement: Aggregate insights from churn models to identify common reasons for attrition, informing product development and feature prioritization.
- Optimized Marketing Spend: Focus acquisition efforts on customer segments less prone to churn, improving Customer Lifetime Value (CLV).
- Personalized Customer Experience: Tailor the customer journey based on churn probability, offering different experiences to high-value, high-risk customers.
- Operational Efficiency: For businesses with physical operations, Operational Analytics Services can use churn insights to optimize service delivery and resource allocation to improve satisfaction.
Ultimately, predictive churn analytics enables a shift from reactive problem-solving to proactive, data-driven strategy.
What are the Common Challenges in Churn Prediction? Data Quality & Bias
While the benefits are clear, building effective churn models comes with its own set of challenges that data scientists must navigate:
- Data Quality and Availability: Incomplete, inaccurate, or inconsistent data can severely hamper model performance. Missing historical data or fragmented customer records are common roadblocks.
- Defining Churn: For non-subscription businesses, defining what constitutes “churn” can be ambiguous (e.g., when has an inactive customer truly left?).
- Class Imbalance: Churn events are often rare compared to non-churn events. This class imbalance can bias models towards predicting the majority class (non-churn), leading to poor detection of actual churners.
- Feature Engineering Complexity: Identifying and creating the most predictive features from raw data requires deep domain expertise and iterative experimentation.
- Model Interpretability vs. Accuracy: Highly accurate models (like deep learning) can sometimes be “black boxes,” making it hard to understand why a customer is predicted to churn, which can hinder actionable insights.
- Concept Drift: Customer behavior patterns can change over time due to market shifts, new competitors, or product updates. Models need to be regularly monitored and retrained to adapt to these “concept drifts.”
- Ethical Considerations & Bias: Ensuring that models do not inadvertently discriminate against certain customer segments based on protected attributes is paramount. This requires careful feature selection and bias testing.
Conclusion: Embracing Churn Analytics for Sustainable Growth
Customer churn is more than just a lost customer; it’s a lost opportunity for revenue, advocacy, and growth. By thoroughly understanding what is customer churn, how to precisely calculate it, and the different forms it takes, businesses lay the groundwork for a robust retention strategy. For data scientists, the challenge lies in leveraging sophisticated customer churn models and rich datasets to accurately predict and explain customer attrition. Embracing advanced analytics for churn prediction is not just a defensive play; it’s a strategic imperative that transforms potential losses into tangible gains, ensuring sustainable business growth and healthier bottom lines.
“If you found this guide useful, join my free Business Intelligence Edge newsletter for weekly, practical data-driven insights to grow your business.”