Operational Analytics Explained: A Plain-English Guide for Business Leaders [2025]

Operational analytics reshapes how businesses make decisions. Many companies still don’t make use of this powerful approach. A 2023 Salesforce study shows that 80% of business leaders call data vital to decision-making. A Seagate report reveals that 68% of available enterprise data remains unused. This represents a huge missed chance.
Operational analytics helps teams make decisions using live data. The approach differs from traditional analytics. Teams can take immediate action to streamline their daily business operations. This field’s value reached $7.92 billion in 2019. Experts predict it will grow to $28.74 billion by 2027. These numbers show its rising importance in the business world.
This piece shows you how operational analytics cuts downtime and boosts productivity. You’ll learn about better forecasting methods. We dive into real-life examples, common use cases, and essential tools. The guide helps both newcomers and experienced professionals. You’ll find everything you need to succeed in 2025 and beyond, explained in plain English.
What is Operational Analytics?
What is Operational Analytics?
Modern businesses need more than historical reports to succeed. They need quick insights that lead to action. This brings us to operational analytics.
Operational analytics definition in plain terms
Operational analytics uses real-time data to help organizations react to current changes. Think of it as your business’s health monitoring system. A doctor combines reports from specialists to give you a complete health picture. Similarly, operational analytics combines logs from different systems to spot problems and suggest solutions.
The focus lies on measuring current and up-to-the-minute operations of the business. It changes decision-making by offering current information instead of just historical data. Teams can make better choices quickly, which affects current outcomes rather than just looking at past events.
Operational analytics also automates data collection from complex systems like data warehouses. This gives quick analysis to guide immediate decisions. The process often involves pulling data from many sources, finding connections between them, and drawing useful conclusions.
How it is different from traditional analytics
Traditional analytics gathers and transforms data to understand company performance. Teams share these reports weekly, monthly, or quarterly. The main goal is to shape strategy rather than take immediate action.
Operational analytics stands apart from traditional approaches in several ways:
- Time horizon: Traditional analytics looks at past data to spot future opportunities. Operational analytics uses current data for daily decisions.
- Response speed: You get almost instant insights with operational analytics. Traditional analytics needs IT specialists or analysts to dig through warehouse data for periodic reports.
- Decision level: Strategic decisions come from traditional analytics. Operational analytics drives quick, tactical actions.
- Data emphasis: Traditional analytics tracks specific KPIs for big-picture insights. Operational analytics uses data actively, like adding product usage details to CRM systems.
Operational data comes from an organization’s daily activities. This current, detailed information powers transactions and supports business processes. Applications, microservices, and event streams capture this data directly.
Why it matters for business leaders
The business world changes fast. Competitors adjust prices or tactics without warning. Customer buying habits shift overnight. Quick awareness of these changes helps businesses adapt better.
Business leaders can make smart decisions faster with operational analytics. Hidden trends and patterns emerge from large amounts of raw data. Leaders watch actual customer behavior in real time instead of waiting for survey results.
Operational analytics gives business leaders clear advantages:
It connects information directly from data warehouses to operational platforms, breaking down data silos. The system spots bottlenecks quickly to improve efficiency. New patterns and insights surface that traditional methods might miss.
Companies that use operational analytics make better decisions faster at scale. Data mining, artificial intelligence, and machine learning help leaders improve customer satisfaction and profits through better transparency.
The money spent on operational insights pays off through better decision-making. Companies collect huge amounts of data through cloud computing, mobile devices, and IoT. Operational analytics ensures this valuable information drives real business value.
The Business Value of Operational Analytics
The Business Value of Operational Analytics
Businesses today must boost performance while cutting costs. Operational analytics creates value by turning raw data into useful information that leads to measurable business results.
Better Decisions Through Immediate Data
Data changes how businesses make decisions. Data-driven decision-making uses multiple sources like customer feedback, market trends, and financial data to guide choices that match business goals. Companies can optimize performance and test strategies before full rollout with immediate insights.
The power of immediate analytics comes from capturing information when it matters most. Delta Airlines shows this perfectly. They spent over $100 million on airport baggage systems that merge flight data to route connecting bags quickly. This led to a remarkable 71% reduction in mishandled baggage between 2007 and 2014.
Netflix’s story proves this point too. They used subscriber data and immediate analytics to become a global streaming leader. Their revenue grew from $3.2 billion in 2011 to $33.7 billion by 2023. These examples show how immediate operational analytics affects business results directly.
Key benefits of using immediate data for decisions include:
- Less uncertainty and more confidence in business choices
- Quick visibility into decision outcomes instead of waiting for reports
- Better customer service through tailored experiences
- Major cost savings by preventing waste and optimizing resources
Quick Response to Operational Issues
Operational analytics cuts problem detection and response times – known as Mean Time to Detect (MTTD) and Mean Time to Respond (MTTR). Teams get alerts about failures before they become major problems by watching data as it enters systems.
This helps prevent lost revenue and reduce risks. Operational analytics platforms can sort customer service tickets automatically and prioritize loyalty club members’ requests. Teams can fix issues as they appear rather than after they disrupt operations.
System downtime drops significantly. Operational analytics helps diagnose and fix problems quickly when systems fail. Utility companies use machine learning and data analytics to predict energy use patterns by analyzing vast amounts of immediate data. This helps prevent outages and keeps service reliable.
Better Forecasting and Planning
AI-powered forecasting brings the biggest business value. AI-driven forecasting models beat traditional spreadsheet methods. Supply chain errors drop by 20-50%, while lost sales and product shortages decrease up to 65%.
These improvements spread across operations. Warehouse costs fall by 5-10% and administration costs drop by 25-40%. AI-driven forecasting uses immediate data and spots new patterns continuously, letting businesses adapt quickly to changes.
Modern platforms improve decisions through live updates and scenario testing. Hershey upgraded its forecasting with an Integrated Dynamic Planning platform to get a complete view of demand planning. Penske Transportation Solutions changed its revenue forecasting too. Their models now give accurate two-year forecasts, updated monthly and checked twice yearly.
Operational analytics connects data to action. Businesses can now act proactively instead of reacting to market shifts and operational challenges.
Key Use Cases Across Business Functions
Key Use Cases in a Variety of Business Functions
Operational analytics creates value in a variety of business functions by turning data into actionable insights. Let’s take a closer look at five critical use cases where this approach makes a measurable difference.
Revenue forecasting and budgeting
Revenue forecasting has grown beyond simple predictions into a sophisticated process that combines multiple data sources. Operational analytics connects historical data analysis, trend identification, correlation analysis, scenario planning, and predictive modeling to create more reliable forecasts. This all-encompassing approach offers significant advantages over traditional methods.
Modern forecasting uses AI and machine learning techniques with real-time data on market trends and sales pipelines. Companies that use predictive analytics see better forecast accuracy, which leads to improved operational performance and competitive advantage.
Accurate revenue forecasting helps leaders make data-backed decisions based on likely future cash availability. They can better allocate resources, set financial goals, assess performance, and manage cash flow, particularly during seasonal fluctuations.
Workforce cost and shift optimization
Labor costs are typically a company’s largest expense, making workforce optimization vital to overall financial health. Businesses can use operational analytics to study employee work patterns and create adaptable schedules that boost productivity while controlling costs.
Data analytics in workforce management shows the best labor schedules and production bottlenecks. Companies can maintain appropriate staffing levels without compromising service quality. Operational analytics also enables compensation analysis to ensure fair employee pay while keeping overall costs in check.
The results speak for themselves 58.2% of businesses report improved agent performance thanks to workforce optimization. Analytics-based scheduling helps cut down employee overlap, track time-off requests, and automate various scheduling aspects.
Customer profitability and churn reduction
Customer profitability analysis (CPA) shows which customers boost profits and which drain resources. Unlike revenue-focused approaches, CPA looks at both revenue generation and costs related to acquiring, serving, and retaining customers. This method helps businesses:
- Identify high-value customer segments based on purchasing behavior
- Break down factors most likely to drive client churn
- Deploy tailored marketing and targeted retention strategies
- Maximize customer profitability through tailored engagement
The simple formula, Customer Profitability = Revenue from Customer – (Acquisition Cost + Service Cost + Retention Cost) provides key insights for strategic decisions. Businesses can then refine targeting, improve retention efforts, adjust pricing strategies, and reduce unprofitable costs.
Supply chain and inventory management
Operational analytics transforms supply chain operations with real-time visibility and predictive capabilities. Companies can analyze various components such as transportation costs, warehousing expenses, and procurement efficiency to find optimization opportunities.
Operational analytics helps businesses predict consumer demand more precisely through real-time ETL processes and central data repositories. Companies can assess supplier performance, spot partners with recurring delays, and address performance issues early.
Benefits flow throughout supply chains. Operational analytics cuts costs, improves margins, reveals supply chain risks, increases planning accuracy, achieves lean operations, predicts market trends, forecasts demand, streamlines invoicing, and provides better inventory visibility.
Capital expenditure planning
Capital expenditure decisions require substantial investments and detailed analysis. Operational analytics lets businesses track actual versus planned spending, timelines, and resource utilization for both ongoing and completed projects.
Organizations can spot ways to improve future planning. Through advanced analytics, asset owners learn more about infrastructure lifecycles, maintenance versus replacement decisions, and asset longevity trends. This data-driven approach frees up capital with potential portfolio savings of 5-15% for more attractive projects.
Operational analytics creates accurate forecasts of capital needs on standard or custom curves, showing how projects will use budget over time. Companies make better decisions about maintaining versus replacing assets, avoiding early replacements that waste resources or too much maintenance on “budgetary sinkholes”.
How Operational Analytics Works Behind the Scenes
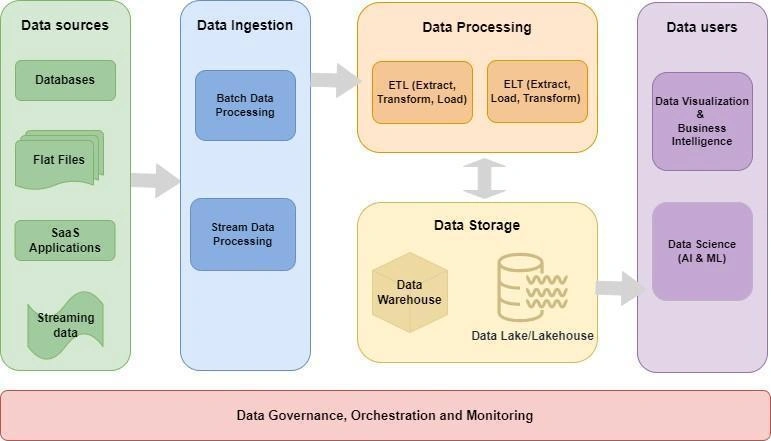
Image Source: DZone
A successful operational analytics system needs a sophisticated infrastructure that collects, processes, and delivers useful insights. Business leaders can better utilize their data assets by understanding these backend processes.
Data sources: CRM, ERP, IoT, and more
Organizations gather operational analytics data from multiple streams. Customer Relationship Management (CRM) systems capture customer interactions, while Enterprise Resource Planning (ERP) platforms measure financial and operational metrics. Internet of Things (IoT) devices contribute live sensor readings from equipment and facilities.
Modern organizations’ IT infrastructure consists of large, interdependent ecosystems where a single problem could affect entire systems. McKinsey reports 99% of organizations have pursued large-scale technology transformations since 2020, creating big data repositories. Additional sources include:
- Point-of-Sale (POS) systems capturing transaction details
- Remote sensors monitoring environmental conditions
- Supply chain management platforms tracking inventory movement
- Employee productivity and workforce management tools
These varied sources create the foundation for complete operational insights that span departments and functions.
Data integration and transformation
Operational analytics platforms must unite data from different sources a process known as data integration. This sophisticated task extracts data from various systems, transforms it into usable formats, and loads it into centralized repositories.
Data ingestion starts the integration process as information flows from multiple systems. Raw data then undergoes cleaning and transformation to ensure accuracy and relevance. Organizations must decide who manages data cleansing and which tools will maximize the information’s value.
Modern operational analytics uses Reverse ETL (Extract, Transform, Load) to query data warehouses and sync information directly to operational systems. Teams can access insights without waiting for batch processing or manual refreshes.
Live dashboards and alerts
Operational analytics delivers its greatest value through immediacy. Live dashboards show interactive views of business operations, which helps identify trends, spot issues, and respond to changes instantly.
These dashboards receive new data through APIs and data streams and present information through accessible visualizations like charts, graphs, and tables. Key Performance Indicators (KPIs) such as Mean Time to Detect (MTTD) and Mean Time to Respond (MTTR) measure operational efficiency.
Digital contact centers’ supervisors use live analytics to optimize service representative allocation, monitor performance metrics, and maintain high service levels.
Predictive modeling and scenario analysis
Advanced operational analytics uses predictive capabilities to forecast likely outcomes. Predictive modeling combines historical data with statistical or machine learning algorithms to make proactive, evidence-based decisions.
These models analyze patterns in current and historical data to generate forecasts that shape decisions about operations, resources, and strategy. Techniques include:
- Simple statistical models for trend analysis
- Classic machine learning models like Random Forest and K-Means clustering
- Advanced neural network-based approaches for complex pattern recognition
Decision services automate decision-making by combining predictive analytics with optimization technologies and business rules. This enables capabilities like predictive maintenance, where businesses detect potential machine failures before they occur by analyzing sensor data and failure patterns.
Operational analytics converts raw data into useful intelligence through a continuous cycle of collection, processing, visualization, and prediction.
Tools and Technologies That Power Operational Analytics
A network of connected tools makes up the technology ecosystem that turns raw data into useful information for operations. Each part of the system plays a key role in analyzing data, from collecting it to showing it visually.
ETL and data pipeline tools
Extract, Transform, Load (ETL) tools are the foundations of operational analytics that move data between different points. These tools pull data from different systems, change its format, and store it in central locations. Organizations have moved toward Extract, Load, Transform (ELT) approaches lately, which load data before changing it to add flexibility.
Today’s data pipelines make complex operations simple with built-in features that handle failures, organize tasks, and adjust computing power automatically. Reverse ETL capabilities complete the cycle by sending insights from data warehouses back to operational systems, which makes analytics readily available to front-end tools.
Business intelligence platforms
Business intelligence (BI) platforms help organizations shape, analyze, and display data to make better decisions. Teams can explore information and monitor important metrics through dashboards and analytics these systems provide.
Modern BI tools give users central data access, let non-technical staff run their own analytics, automate reports, and predict trends. The global BI and analytics software market will grow from $22.80 billion in 2020 to $147.19 billion by 2025.
In-memory processing and real-time engines
Analytics traditionally uses databases stored on disks, which creates delays in processing. In-memory technologies solve this problem by running entire algorithms directly in large memory pools, which makes response times much faster.
Stream processing tools can handle large amounts of continuous data for almost immediate analysis. Services like Azure Event Hubs process millions of events per second quickly, which makes them perfect for high-volume situations.
AI and machine learning capabilities
AI and machine learning enhance operational analytics by letting systems learn from data without specific programming. Models get better at their tasks as they assess more data.
TensorFlow, PyTorch, and IBM Watson provide frameworks to build analytics models. These technologies enable predictive analytics, find unusual patterns, improve performance, and automate processes—which makes operations more efficient across organizations.
Visualization and reporting tools
Data visualization tools bridge the gap between analysis and action by turning complex data into easy-to-understand charts and graphs. Some popular platforms include:
Tableau, which can combine data from multiple databases and create custom visuals; Power BI, which works naturally with Microsoft’s ecosystem; and Google Data Studio, which connects easily to Google’s products.
These visualization tools make complex data analysis simpler, help generate insights faster, and improve decision-making at every level of business operations.
Steps to Implement Operational Analytics in Your Organization
A successful operational analytics implementation needs careful planning and execution to maximize value. Here’s a roadmap that shows the key steps to build an effective operational analytics function in your organization.
Define goals and KPIs
Your implementation should start by identifying specific business objectives. Senior executives, department managers, and team members need to work together to line up the entire organization’s goals. Your operational KPIs should directly support these broader business goals. Companies that don’t connect KPIs to strategic business objectives often face adoption challenges. Pick metrics that show your company’s position relative to its goals. The metrics should balance both short-term and long-term needs to handle immediate requirements and future planning.
Ensure data quality and availability
Organizations lose an average of USD 12.90 million yearly due to poor data quality. This makes data quality a crucial step. Make sure your data is available and accurate before moving forward. Build a modern data quality program that has clear scope and key measurement processes. Your focus should be on the most relevant dimensions accessibility, accuracy, completeness, consistency, precision, relevancy, timeliness, uniqueness, and validity. Data profiling helps spot potential quality issues by scrutinizing source data structure, content, and relationships.
Select the right tech stack
Your choice of tools can make or break the implementation. The analytics platform should connect all relevant data sources while staying user-friendly. Look for tools that offer strong integration features to connect your entire tech stack. Do an AI readiness assessment to find gaps in data quality, integration, and employee skills before making big investments. Bad tool choices can lead to unusable data, which costs businesses about USD 15 million each year.
Pilot and scale gradually
Start small to test the system and get feedback. This helps you find issues before going full scale. Pick the “low-hanging fruit” valuable opportunities without major obstacles. Work on projects that have clear champions who adopt early and can share success stories. Document new processes and train your teams well after successful testing. Keep track of performance and adjust as needed during this phase.
Promote cross-team alignment
Breaking down silos is key to operational analytics success. Set common, customer-focused goals instead of letting each department chase its own metrics. Teams should communicate often to stay aligned, share insights, and avoid misunderstandings. Create well-laid-out feedback loops to stay connected with real customer needs and act quickly. Cross-functional alignment helps teams share knowledge, boost productivity, create efficient processes, and increase transparency.
Conclusion
Real-time data has revolutionized how businesses operate through operational analytics. This piece shows how modern analytics goes beyond historical data to focus on immediate actions. Companies that know how to make evidence-based decisions gain clear competitive advantages in today’s ever-changing business world.
Research proves that companies using operational analytics make better decisions, solve problems faster, and forecast more accurately. These improvements lead to lower costs and better customer experiences that boost financial results.
Operational analytics works in many business areas. It helps companies optimize their workforce schedules and predict when customers might leave. The technology behind these tools keeps getting better, making advanced analytics more available to businesses of all sizes.
Starting small and growing step by step is the best way to succeed. Your organization can build expertise and prove value before taking on bigger challenges. Teams that arrange their efforts ensure insights turn into action across the company.
Companies that adapt quickly own the future. Operational analytics gives businesses the tools to succeed when times are uncertain. The setup needs careful planning, but smart companies find the investment worth their time and effort.
Building a data-driven company doesn’t happen overnight. All the same, businesses that begin their analytics experience today will make smarter choices and optimize their operations tomorrow. The real question isn’t about the cost of investing in operational analytics – it’s about the cost of waiting too long to start.
Key Takeaways
Operational analytics transforms businesses by turning real-time data into immediate action, enabling faster decisions and better outcomes across all functions.
• Real-time decision power: Unlike traditional analytics that reviews past performance, operational analytics uses live data to drive immediate business decisions and responses.
• Measurable business impact: Companies implementing operational analytics see 20-50% reduction in forecasting errors and up to 65% decrease in lost sales.
• Cross-functional value creation: From workforce optimization to supply chain management, operational analytics delivers actionable insights across every business function.
• Start small, scale smart: Begin with pilot projects focusing on high-value, low-complexity opportunities before expanding to organization-wide implementation.
• Technology enables transformation: Modern tools like AI, machine learning, and real-time processing platforms make sophisticated analytics accessible to businesses of all sizes.
The key to success lies in connecting data quality, appropriate technology selection, and cross-team alignment to create a unified approach that transforms raw information into competitive advantage.
FAQs
Q1. What is operational analytics and how does it differ from traditional analytics? Operational analytics uses real-time data to drive immediate business decisions, focusing on day-to-day operations. Unlike traditional analytics that relies on historical data for strategic planning, operational analytics enables quick responses to current changes and supports tactical decision-making.
Q2. How can operational analytics improve business performance? Operational analytics enhances business performance by enabling faster decision-making, improving problem detection and resolution times, and enhancing forecasting accuracy. It helps businesses respond quickly to market changes, optimize resources, and drive measurable outcomes across various functions.
Q3. What are some key use cases for operational analytics? Key use cases for operational analytics include revenue forecasting and budgeting, workforce cost optimization, customer profitability analysis, supply chain management, and capital expenditure planning. These applications help businesses make data-driven decisions that improve efficiency and profitability.
Q4. What tools and technologies are essential for implementing operational analytics? Essential tools for operational analytics include ETL and data pipeline tools, business intelligence platforms, in-memory processing engines, AI and machine learning capabilities, and data visualization tools. These technologies work together to collect, process, analyze, and present data for actionable insights.
Q5. How should an organization start implementing operational analytics? To implement operational analytics, organizations should begin by defining clear goals and KPIs, ensuring data quality and availability, selecting the right technology stack, starting with small pilot projects, and fostering cross-team alignment. This approach allows for gradual scaling and helps build expertise while demonstrating value.