Customer Analytics Strategy Framework: What Successful SMEs Do Differently in 2025

A 5% boost in customer loyalty can boost profits by 25% to 95%. Small and medium enterprises now use customer analytics strategy as their secret weapon to achieve these impressive results.
Many SMEs find it hard to make use of business analytics properly. Research shows that 70% of consumers can tell the difference between companies that use AI well in customer service and those that don’t. Companies often collect lots of data but struggle to turn it into applicable information when they lack a clear customer insights framework. This challenge matters even more because 33.2 million SMEs represented 99.9% of all US businesses in 2022.
This detailed guide will help your business build a customer analytics framework that delivers results. We’ll show you what successful SMEs do differently with their data in 2025. You’ll learn how they track the right metrics and turn customer insights into meaningful business changes. Remember, serving your customers better remains the main goal of any customer analytics strategy.
- Customer Analytics Strategy Framework: What Successful SMEs Do Differently in 2025
- Understanding the Customer Analytics Strategy Framework
- What is Customer Analytics Strategy Framework
- Setting Business Goals That Drive Analytics
- Mapping the Customer Journey for Data Collection
- Choosing the Right Data Sources for SMEs
- Customer Segmentation for Actionable Insights
- Implementing Business Analytics Tools Effectively
- Turning Insights into Business Actions
- Measuring and Iterating the Strategy Over Time
- Conclusion
- Key Takeaways
- FAQs
Understanding the Customer Analytics Strategy Framework
A customer analytics strategy framework works as a blueprint that turns raw data into business decisions you can act on. This framework gives businesses the structure and methods they need to collect, analyze, and use insights from how customers interact and behave.
What is Customer Analytics Strategy Framework
The customer analytics strategy framework works like a roadmap. It helps businesses make sense of their customer data. Small and medium businesses can do more than just collect data – they can use it to grow their business.
Customer analytics is all about gathering data from different sources to learn about customer behavior, priorities, and needs. You need both tech tools and proper methods to organize and make sense of all this information. Many businesses collect lots of data, but a good analytics framework turns this information into strategies that work.
Why SMEs Need a Structured Customer Insights Framework
Small and medium businesses need a structured customer insights framework to survive in today’s competitive market. A McKinsey survey shows companies that use customer analytics extensively saw 115% higher ROI and made 93% more profit than their competitors. These numbers show how much a well-planned analytics strategy can help.
There’s another reason why these frameworks matter even more for SMEs:
Limited resources mean every business decision must be right. A customer insights framework helps SMEs focus on projects that will affect their business most. This stops them from wasting money on features customers don’t want.
SMEs usually have smaller data teams than big corporations. A structured framework lets these small teams work better. They can focus on collecting and analyzing only the data that matters most.
Research shows 71% of customers want personalized interactions. SMEs can’t offer this level of personalization without a good system to understand what customers need.
Atom Bank shows how well these frameworks can work. They brought together seven different customer feedback channels and got rid of data silos. This led to 40% fewer support calls and 110% more customers. LendingTree also did well – they looked at over 20,000 customer comments in 90 days using a structured approach. This helped them find key themes that shaped their products.
Difference Between Customer Analytics and Business Intelligence
Customer analytics and business intelligence serve different purposes in a company’s data strategy. SMEs need to know these differences to pick the right solutions for their needs.
Business intelligence looks at what happened in the past and present. It changes raw data into useful information about past performance and current operations. BI uses dashboards, reporting platforms, and data visualization systems. These tools track KPIs, find trends, and spot areas that need improvement. It helps with day-to-day decisions by providing current or recent information.
Customer analytics goes deeper into why things happened and what might happen next. It does more than track numbers, it uses statistics, predictive modeling, and machine learning to forecast future outcomes. This helps businesses spot customer needs and market trends early.
The data types each method uses are different too. Business intelligence usually works with structured data from regular databases, things like sales numbers, financial data, or inventory metrics. Customer analytics looks at unstructured or semi-structured data like social media posts, customer reviews, and support tickets.
Here’s a real example of how they’re different:
Business intelligence might tell you sales went down in one region last month. Customer analytics would explain why and predict if this will keep happening. It might show that customers are switching to a competitor’s new product.
SMEs planning their data strategies in 2025 should use both methods. Business intelligence helps track performance and find problems. Customer analytics helps understand why these problems happen and create solutions for the future.
Setting Business Goals That Drive Analytics
Business analytics works best with clear goals. Small and medium businesses starting customer analytics in 2025 need the right objectives. This will help them collect useful data and avoid getting lost in meaningless numbers.
Arranging KPIs with Customer-Centric Objectives
Key Performance Indicators (KPIs) help organizations measure their progress toward operational and strategic goals. Market leaders don’t just track more metrics. They use these metrics to boost customer participation and grow their business.
Top companies understand their customers’ challenges in today’s digital world. They create customer experience KPIs that go beyond traditional sales funnels. Companies that excel at measurement are more likely to use KPIs. This gives them a better view of their customers and a competitive edge.
A study of businesses of all sectors showed they are more than four times as likely to focus on customer-related KPIs over other measurements. Yes, it is true that 38% of people mentioned “customer” in their answers. The next most common word “sales” showed up in just 9% of responses.
Your KPIs should match customer-focused objectives by:
- Finding your main business goals like better customer retention, more revenue, or smoother operations
- Picking metrics that support these goals and provide practical insights
- Checking these KPIs often to make sure they still fit your changing business goals
Your metrics should change as your business grows. Be ready to update your KPIs when customer needs shift during your growth.
Examples of Goals: Retention, NPS, and Revenue Impact
Customer Retention Goals
Small businesses must pay attention to retention metrics. About 61% of SMBs say repeat buyers make up more than half their revenue. Getting a new customer costs 5 to 20 times more than keeping an existing one.
You need to calculate your Customer Retention Rate (CRR) to set good retention goals. The formula is: CRR = [(E-N)/S] x 100. Here, ‘S’ means starting customers, ‘E’ is ending customers, and ‘N’ shows new customers gained in that time. Small businesses should aim for at least 20% CRR. Big insurance or media companies look for rates above 79%.
Net Promoter Score (NPS) Goals
NPS shows how likely customers are to recommend your brand, a clear sign of loyalty. Companies with the highest NPS grow 2.5 times faster than others in their industry. The London School of Economics found that raising NPS by 7 points leads to 1% more revenue.
Global standards say an NPS above 50 is good, while scores over 70 are exceptional. Both are hard to achieve, so comparing with competitors helps small businesses set realistic targets.
Revenue Impact Goals
Revenue goals tied to customer analytics show clear financial results. Studies show that a 10-point NPS increase can boost sales by 20%. Companies in the top quarter of NPS scores have 13% higher customer lifetime value than similar businesses.
Small businesses with tight budgets can get good results by reducing customer loss through analytics. Cutting customer loss by 15% through NPS programs saves millions in new customer costs. Repeat customers spend 67% more over time than first-time buyers.
The best goal-setting connects your customer analytics plan to specific business results, whether that’s higher retention, better NPS scores, or improved revenue. This focused approach makes sure your analytics work creates real value instead of just interesting data you can’t use.
Mapping the Customer Journey for Data Collection
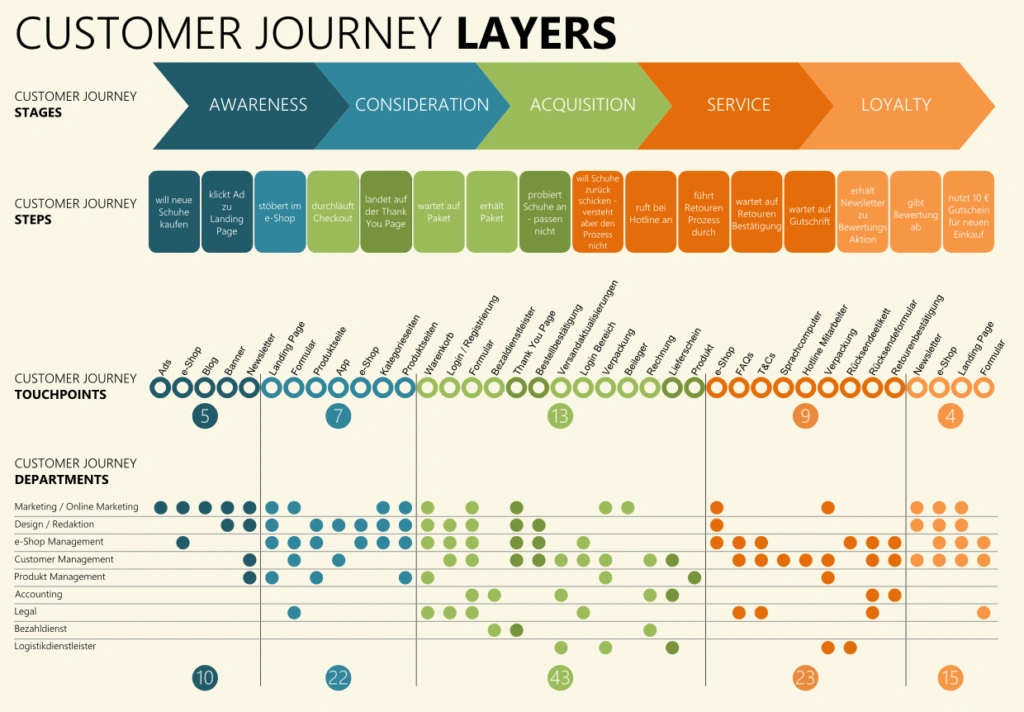
Image Source: InMoment
Customer journey mapping serves as the life-blood of any working customer analytics strategy. Your business can collect targeted information that optimizes operations and improves customer experience by visualizing customer interactions.
Identifying Key Touchpoints Across Channels
Every direct or indirect interaction between customers and your brand represents a touchpoint throughout their trip. These defining moments shape customer experience and offer valuable chances to gain insights. Small and medium businesses implementing analytics must identify these touchpoints accurately to collect targeted information.
Touchpoints typically fall into three main categories:
- Pre-purchase touchpoints: Advertisements, social media, online reviews, word-of-mouth recommendations, and website visits
- Purchase touchpoints: Point of sale interactions, website checkout processes, sales conversations, and initial product setup
- Post-purchase touchpoints: Invoicing, support interactions, product usage, feedback surveys, and renewal notifications
Journey mapping starts with listing every possible way customers interact with your business. This list should include digital touchpoints like website visits, email communications, and social media interactions along with physical ones such as in-store visits, phone calls, and product usage.
Small and medium businesses need a complete inventory of all customer interaction channels. Research shows customers rarely follow a single linear path, they interact with businesses through multiple touchpoints in channels of all types. Understanding these varied pathways helps implement business analytics successfully.
Market-leading SMEs in 2025 stand out by connecting these touchpoints into a unified view of the customer journey. These businesses track customer movement between touchpoints to understand the complete experience instead of seeing each interaction separately.
Using Journey Maps to Spot Friction Points
Creating visual representations of the entire journey follows touchpoint identification in your customer analytics strategy. Journey maps offer a central resource to understand each customer experience step. These visuals help locate areas where customers face challenges known as friction points.
Journey maps reveal key insights that might stay hidden in isolated data. A telecommunications company found specific points of customer difficulty by mapping customer journeys, which led to targeted improvements.
Journey maps can spot friction points effectively through these steps:
Document customer emotions and attitudes at each touchpoint to identify frustration or confusion. Add performance metrics like Net Promoter Score (NPS) to your journey map to measure specific touchpoint impact on overall satisfaction. Visualization tools help identify patterns such as rapid sentiment drops or sawtooth patterns that show inconsistent experiences.
Customer journey analytics tools can find choke points or “rage events” where customers face major frustration. Analysis of these friction points helps prioritize improvements based on customer satisfaction and business outcomes.
Many SMEs find that transitions between touchpoints create the most friction through journey mapping. One brand’s NPS scores dropped significantly when customers needed to reschedule repair appointments. The data showed customer frustration stemmed from repeating the same booking process.
Journey mapping helps SMEs implement focused data collection strategies that target the most influential moments in customer experience. This approach will give your customer insights framework practical data without overwhelming your team with unnecessary information.
Choosing the Right Data Sources for SMEs
Small businesses need the right data sources to build effective customer analytics. Limited resources mean they must be smart about collecting and using their data.
Survey Data vs Behavioral Data: What to Prioritize
Small businesses face a crucial choice between two types of data when they build their customer analytics strategy: survey data that customers tell you and behavioral data that shows what they do. Each type works better for different business goals.
Survey data comes from asking customers direct questions about their experiences. Behavioral data tracks what customers actually do – their purchases and how they interact with your business. This difference helps you choose the right approach.
Surveys excel at telling the story behind customer choices. They reveal why customers make certain decisions and show parts of the customer’s trip that behavior tracking might miss. To cite an instance, a quick survey can tell you how store layout, signs, or weather affect buying decisions.
Behavioral data works best when customers make quick decisions without much thought. Studies show people often can’t explain their full buying process because they don’t notice everything that influences them. This data helps avoid the “overclaim” effect – where people say they care about something like privacy but act differently.
Small businesses starting with analytics should follow these guidelines:
- Use surveys when customers take time to think about decisions and can state their reasons
- Pick behavioral data for quick, instinctive decisions
- Time your surveys right – ask questions right after an experience to get accurate answers
Many businesses already have enough information to start analyzing data. Their spreadsheets, databases, CRM tools, and available market data are a great way to get started.
Combining CRM, Social, and Support Data Streams
The most successful small businesses in 2025 know that mixing different types of data creates better insights than using just one source. This gives them a complete picture of how customers interact with their business.
Small businesses get amazing results when they connect their CRM with social media. This helps them learn about their customers by watching interactions across platforms and understanding behavior and priorities. Companies can then improve their marketing and customer service without spending too much.
Social media also works great for customer support. People often share their concerns on social platforms, so linking these with CRM helps businesses watch all channels, spot issues early, and fix problems quickly.
Other useful data sources include:
- Support center software that reads customer messages and checks their mood using Natural Language Processing
- Website tracking tools that follow customer’s online activities
- Marketing data showing which messages work best
- Customer feedback from everywhere combined into one view
Connecting these different data sources removes the manual work that often slows down small businesses. They should start by linking their most important sources – usually CRM, website tracking, and customer support systems.
This smart approach to picking and connecting data helps small businesses build customer analytics that work as well as bigger companies, without needing as much money. Success comes from choosing the right data sources for your goals and connecting them to understand your customers better.
Customer Segmentation for Actionable Insights
Customer segmentation is the life-blood of any reliable analytics strategy. You can personalize experiences and focus resources on areas with the best returns by splitting your customer base into meaningful groups.
Behavioral vs Demographic Segmentation
Demographic segmentation groups customers by their visible traits like age, gender, income, education, and occupation. This method helps understand who your customers are. The approach is simple but demographic data tells us little about future actions and customer intent.
Behavioral segmentation looks at what customers actually do – their buying patterns, product usage, website visits, and responses to marketing campaigns. This method groups users based on how they interact with your brand and reveals valuable patterns that demographics miss.
Research shows behavioral segmentation works better:
- 3.2x higher conversion rates (6.8% vs 2.1% with demographic)
- 5x greater customer lifetime value
- 78% accuracy in predicting next purchases (compared to 45% for demographic)
Behavioral segmentation gives exceptional results for SMEs using business analytics because it shows direct proof of customer intent and interest. Customer behaviors change constantly and create live opportunities to tailor experiences, unlike fixed demographic data.
Zoomcar showed these benefits when they launched Zap Cars subscription service. They looked at behavioral factors like booking frequency, weekday/weekend priorities, and discount sensitivity. This helped them find a specific segment of just 2-3% of their customers. Their focused strategy led to a 50% conversion increase with minimal cost.
Most successful SMEs use both approaches together. Demographics create broad customer groups for original targeting. Behavioral data then builds micro-segments within these groups to tailor engagement.
Using AI to Identify High-Value Segments
AI has changed how businesses handle customer segmentation. Traditional methods depend on manual analysis and fixed rules. AI processes huge amounts of data live and finds patterns humans might miss.
Companies using AI-powered segmentation get great results:
- 10% increase in customer engagement
- 5% growth in overall sales
AI excels at finding valuable customer segments through prediction. Machine learning algorithms analyze past behaviors to predict future actions – like chances to convert, leave, or upgrade. This lets businesses target their best prospects early.
Netflix uses this approach well. They predict which users might cancel subscriptions and send tailored retention offers before customers leave.
AI helps find “hidden segments” in your customer base – groups that human analysis missed but offer significant value. It also enables dynamic segmentation that adjusts as customer behaviors change, staying accurate as markets evolve.
Small businesses don’t need huge investments to use AI-driven segmentation. Tools like Amplitude Audiences help organize customer segments using both demographic factors and behavioral patterns. Microsoft’s Customer Insights lets businesses create segments from interaction data across marketing channels, websites, and events.
Finding your most valuable segments through AI analysis creates a foundation for targeted marketing. This maximizes ROI with minimal waste – exactly what successful SMEs need in today’s competitive world.
Implementing Business Analytics Tools Effectively
Analytics tools are the driving force behind any successful customer insights framework. Small businesses are increasingly making use of business analytics tools, with nearly 70% of them investing in these solutions. The right solutions must be selected and blended into existing systems to maximize results.
Tool Selection: GA4, Clarity, Amplitude for SMEs
Your specific business needs should guide the selection of analytics tools. Google Analytics 4 (GA4) provides SMEs a free yet robust foundation. It tracks user interactions on websites and apps throughout the customer lifecycle. The platform shines at cross-channel attribution and predictive analytics. This helps businesses optimize their marketing efforts and understand their customers better.
Microsoft Clarity adds features that GA4 doesn’t offer – session recordings and heatmaps. This free tool helps businesses see exactly how visitors use their websites. The system creates a custom dimension called “Clarity Playback URL” in GA4. This connection lets you link quantitative data with qualitative insights.
Amplitude takes behavioral analysis to the next level. It focuses on user interactions with advanced features like cohort analysis to track user retention. The platform monitors interaction patterns on multiple devices and provides valuable information about complex user behaviors. Companies that use Amplitude’s advanced analytics see impressive results, including a 10% boost in customer engagement.
Integrating Tools with CRM and Feedback Systems
Connecting analytics tools with CRM systems removes data silos between departments. This improves data accuracy and optimizes operations. The all-encompassing approach gives a detailed view of customer interactions at every touchpoint. Better decisions follow naturally.
Small businesses with limited resources benefit from CRM integration with analytics tools. The system enables up-to-the-minute tracking of visitor behavior through key metrics. These include website traffic, conversion rate, and bounce rate. The integration helps businesses learn about customer demographics, purchase history, and behaviors that shape targeted marketing campaigns.
Ready-to-go dashboards make analytics tools practical and useful. These pre-built visualizations help teams spot opportunities quickly. They can act on trends, monitor performance, and share current insights across devices without needing technical expertise.
The selected tools should grow with your business and work well with your current systems. The best strategy combines tools that offer quick tactical insights and deeper analytical capabilities that expand with your customer analytics strategy.
Turning Insights into Business Actions
Raw data makes up only half of your customer analytics experience. Your sophisticated analytics strategy won’t deliver real value without good ways to turn evidence-based findings into action.
Creating Feedback Loops with Product and Marketing Teams
The most successful SMEs build well-laid-out feedback loops that share customer findings throughout their organizations. Many businesses fail because the Analytics team holds onto valuable discoveries instead of sharing them with Sales, Marketing and other departments. Your insights should reach internal users quickly in a format that supports up-to-the-minute decision-making.
A good feedback loop follows a simple pattern: input, process, adjust, continue. This method keeps your business lined up with customer needs during product development. Analytics team members should work directly with other departments to give a steady stream of findings to the core team.
You should know your internal “clients”, their customer information needs, and how they’ll apply this knowledge before setting up feedback loops. This focused strategy will drive product improvements and marketing initiatives.
Prioritizing Themes Using Impact vs Effort Matrix
The Impact-Effort Matrix helps you pick which initiatives deserve attention first after gathering customer insights. This tool weighs each action’s potential value against implementation effort.
The matrix divides opportunities into four quadrants:
- Quick wins (high impact/low effort): All but one of these options should take priority
- Big bets (high impact/high effort): These need careful planning but can set you apart in the market
- Fill-ins (low impact/low effort): Simple tasks with minimal returns
- Money pit (low impact/high effort): You should avoid these time-wasters
This prioritization framework paired with steady feedback loops will turn your customer analytics strategy into business growth. Organizations can improve their customer data use, analytics speed, and strategic decision-making over time.
Measuring and Iterating the Strategy Over Time
A customer analytics strategy needs constant evaluation and refinement to work well. After implementation, the priority changes to performance measurement. Companies must make evidence-based adjustments to enhance their business results.
Tracking NPS, CSAT, and Churn Post-Implementation
Smart SMEs see tracking as an ongoing process rather than an endpoint. Net Promoter Score (NPS) tracking creates a continuous cycle that measures, analyzes and reviews customer loyalty over time. Companies that effectively use customer feedback see a 15% increase in customer retention rates.
Customer Satisfaction Score (CSAT) serves as another key metric. The score comes from dividing positive responses by total responses and multiplying by 100. Different industries interpret these scores differently. A CSAT below 50% shows worrying levels of customer dissatisfaction.
The churn rate helps spot deeper problems with products or services. This metric shows what percentage of customers leave during a specific period. Subscription-based businesses should aim to keep their annual churn rate under 7%.
These metrics connect in meaningful ways. High NPS scores often relate to better retention and lower churn rates, which boost customer lifetime value. Harvard Business Review research shows that customers who gave low effort scores demonstrated strong loyalty – 94% said they would buy again.
Updating Segments and Goals Quarterly
Customer behaviors keep evolving. Regular reviews of segmentation models become essential. Current data compared against your highest propensity segments from previous periods reveals valuable pattern changes. Marketing campaigns may become less effective without regular model updates that target previously identified segments.
Good quarterly planning includes 30-60 minute team check-ins every two weeks. This helps everyone stay focused on 30-day milestone periods. The process needs flexibility. Teams should adjust goals when plans show signs of failure or after customer feedback arrives.
A detailed strategy session reviewing the previous four quarters’ performance should happen before each new year. This helps teams spot learning gaps, communication problems, or motivation issues that need attention.
Conclusion
Customer analytics has become essential for SMEs that want to thrive in 2025’s competitive scene. This piece explores how successful small and medium enterprises turn raw customer data into business advantages through well-laid-out frameworks.
A successful customer analytics strategy needs clear business goals that line up with customer-focused objectives. Companies focusing on customer-related KPIs perform better than competitors, especially when they track retention metrics, NPS scores, and revenue effects.
Customer experience mapping makes a real difference. SMEs can get unmatched understanding of customer experiences by finding key touchpoints and friction points. This helps businesses collect relevant data to make meaningful improvements instead of getting lost in unnecessary metrics.
Data sources play a crucial role in the process. Behavioral data offers better predictive capability, but successful SMEs combine it with demographic information. This creates a complete picture of their customer’s identity and actions.
Machine learning segmentation has without doubt changed the game. Modern SMEs use AI algorithms to find valuable customer segments with great accuracy. This enables targeted marketing that maximizes ROI while saving resources.
Analytics tools power these initiatives effectively. GA4, Microsoft Clarity, and Amplitude work best when they combine smoothly with CRM systems and feedback tools. This combination breaks down data silos and shows a clear view of customer interactions.
The most successful SMEs create feedback loops between analytics teams and other departments. These loops, along with impact-effort frameworks, turn insights into product improvements and marketing campaigns.
Customer analytics needs constant evaluation and updates. Tracking NPS, CSAT, and churn metrics regularly, plus updating segmentation models and business goals quarterly, keeps analytics in sync with changing customer behaviors.
SMEs using this framework set themselves up for impressive growth. Small improvements in customer retention just 5% can boost profits by 25% to 95%. It also helps deliver customized experiences at scale, giving businesses an edge as customer expectations change.
Note that serving customers better remains the main goal of any customer analytics strategy. Data and analytics help understand their needs deeply and respond better. Your SME can join businesses that excel through customer-focused excellence in 2025 and beyond by following this approach.
Key Takeaways
Successful SMEs in 2025 leverage customer analytics as a strategic weapon, with companies using analytics extensively reporting 115% higher ROI and 93% higher profits than competitors.
• Prioritize behavioral over demographic data – Behavioral segmentation delivers 3.2x higher conversion rates and 5x greater customer lifetime value than demographic approaches.
• Focus on customer-centric KPIs that drive retention – Just 5% improvement in customer loyalty can increase profits by 25-95%, making retention metrics essential.
• Map customer journeys to identify friction points – Systematic touchpoint analysis reveals where customers struggle, enabling targeted improvements that reduce support calls by up to 40%.
• Integrate multiple data streams for comprehensive insights – Combining CRM, social media, and support data eliminates silos and creates unified customer views that drive better decisions.
• Use AI-powered segmentation to find high-value customers – Machine learning identifies hidden segments and predicts future behaviors, enabling precise targeting with minimal resource waste.
• Create structured feedback loops between teams – Analytics insights must reach product and marketing teams in actionable formats to translate data into real business improvements.
The framework’s power lies in its systematic approach moving beyond data collection to actionable insights that directly improve customer experiences and business outcomes. SMEs that implement this structured methodology position themselves for sustainable competitive advantage in an increasingly data-driven marketplace.
FAQs
Q1. What is a customer analytics strategy framework? A customer analytics strategy framework is a structured approach that helps businesses collect, analyze, and utilize customer data to make informed decisions. It provides a roadmap for transforming raw data into actionable insights that can drive business growth and improve customer experiences.
Q2. How can SMEs benefit from implementing a customer analytics strategy? SMEs can gain significant advantages by implementing a customer analytics strategy, including improved customer retention, increased profitability, and more personalized customer experiences. This approach allows smaller businesses to compete effectively with larger corporations by making data-driven decisions and optimizing their resources.
Q3. What are some key metrics SMEs should track in their customer analytics strategy? Important metrics for SMEs to track include Customer Retention Rate (CRR), Net Promoter Score (NPS), and Customer Satisfaction Score (CSAT). These metrics provide valuable insights into customer loyalty, likelihood to recommend, and overall satisfaction with products or services.
Q4. How does AI contribute to customer segmentation in analytics? AI enhances customer segmentation by analyzing large datasets to identify patterns and predict future behaviors. This allows businesses to create more accurate and dynamic customer segments, enabling highly targeted marketing efforts and personalized experiences that can significantly improve engagement and conversion rates.
Q5. How often should SMEs update their customer analytics strategy? SMEs should regularly review and update their customer analytics strategy, ideally on a quarterly basis. This involves reassessing customer segments, reviewing performance metrics, and adjusting goals based on new insights and changing market conditions. Regular updates ensure the strategy remains aligned with evolving customer behaviors and business objectives.