7 Proven Sales Forecasting Models That Cut Error Rates by 60%

Sales forecasting models are crucial for business survival, not just nice-to-have tools. The numbers tell the story, almost 80% of sales organizations miss their forecasts by more than 10%.
The reality might shock you. Gartner’s research reveals that all but one of these sales leaders lack high confidence in their forecasts. Our findings paint a similar picture just 43% of organizations forecast within 10% accuracy. The situation gets worse 10% of teams miss their targets by more than 25% regularly. These figures represent more than statistics, they show missed opportunities, wasted resources, and unexpected setbacks that can devastate revenue teams.
The right sales forecasting methodology turns uncertainty into applicable information. Smart, informed decisions become possible when you forecast sales regularly. The options to forecast sales accurately have never been better – from time series models that use historical data points to advanced predictive machine learning models.
This piece explores seven proven sales forecasting methods. These methods can slash your error rates significantly and deliver real benefits: more accurate budgets, better resource allocation, and stronger financial resilience.
Historical Data Analysis
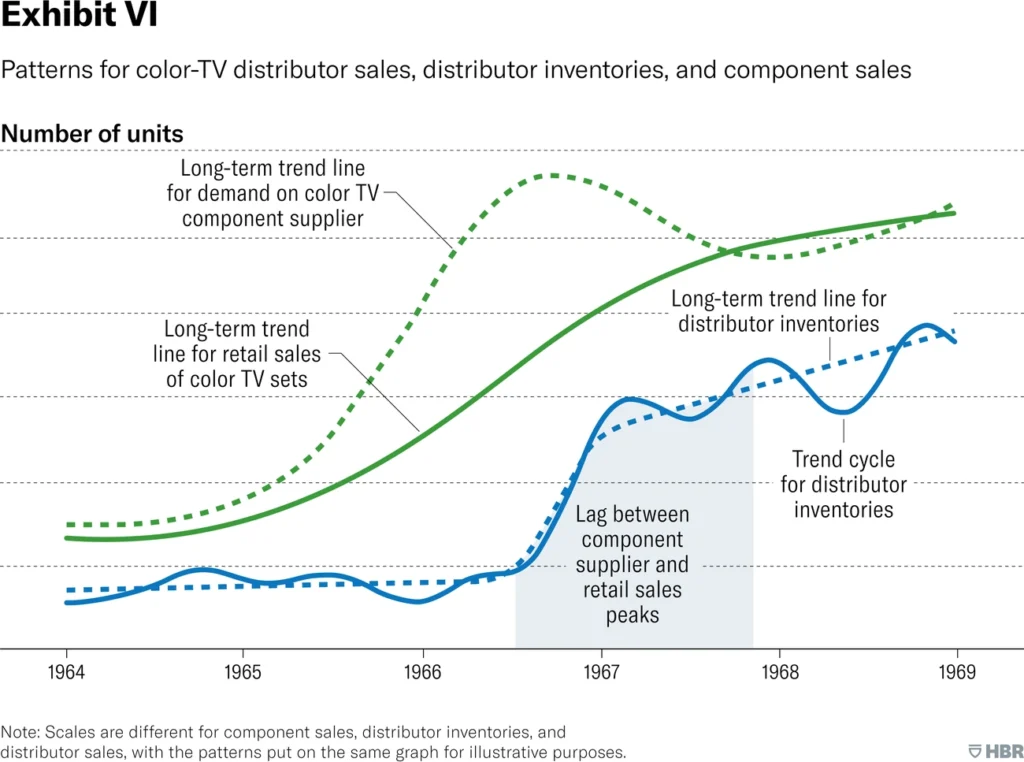
Image Source: Harvard Business Review
Past performance gives us the clearest picture of future outcomes. Historical Data Analysis serves as one of the most reliable sales forecasting models. It gives businesses a solid foundation to predict revenue based on previous results.
Historical Data Analysis: What it is
Historical Data Analysis helps predict future revenue by looking at past sales trends, patterns, and performance data. This forecasting approach employs your existing sales records to find recurring patterns, seasonality, and growth trajectories that influence future outcomes. Your company’s past becomes a teacher that guides predictions about its future.
The process has these key steps:
- Collecting and organizing past sales figures by product, time period, and other relevant categories
- Looking at data to find patterns, trends, seasonality, and growth indicators
- Creating projections based on identified patterns and trends
- Monitoring and adjusting forecasts as new data becomes available
This method goes beyond numbers. It studies how sales performance connects with customer demographics, industry trends, and economic conditions to build a complete forecast.
Historical Data Analysis: Why it works
Historical forecasting works because it builds on actual business performance rather than guesswork. Hard data proves what happened in your business, unlike gut feelings or market assumptions.
Past data reveals hidden patterns and trends. Companies can find seasonal changes, peak sales periods, and customer behaviors by studying sales data across multiple periods. Retailers often see sales spikes during specific seasons, to name just one example.
This analysis lets companies track trends, set standards, and make better risk assessments. The predictive analytics market grew to $5.29 billion in 2020 and will reach $41.52 billion by 2028. These numbers show its growing importance.
Historical data analysis boosts several key business areas:
- Better risk evaluation
- More accurate forecasting
- Understanding of seasonal trends
- Better resource planning
Past insights prove valuable in earnings models. They show seasonal patterns and long-term growth indicators that guide strategic decisions. Companies learn not just what happened but why it happened, which leads to better predictions.
Historical Data Analysis: When to use it
Specific conditions and business needs make historical forecasting most effective. This sales forecasting methodology works best in these situations:
For established businesses: You need at least a year’s worth of data to set reliable standards. New companies should use other forecasting methods until they gather enough data.
In relatively stable markets: Markets that stay consistent make historical forecasting more reliable. Past performance can predict future outcomes better. In these settings, historical growth between periods becomes a trusted indicator.
When analyzing seasonal patterns: Companies with cyclical sales patterns benefit from historical data. It helps measure these changes and plan for seasons more accurately.
For setting realistic sales quotas: Many companies use historical data to set sales quotas. They base new targets on past achievements or trends.
In combination with other methods: Historical data works best among other forecasting approaches like pipeline forecasting or opportunity stage forecasting. Using multiple methods helps cover the gaps in historical analysis alone.
We have a long way to go, but we can build on this progress. Market disruptions, new competitors, or economic changes might affect its accuracy. Regular updates with fresh data will keep your sales forecasting model relevant.
Regression Analysis
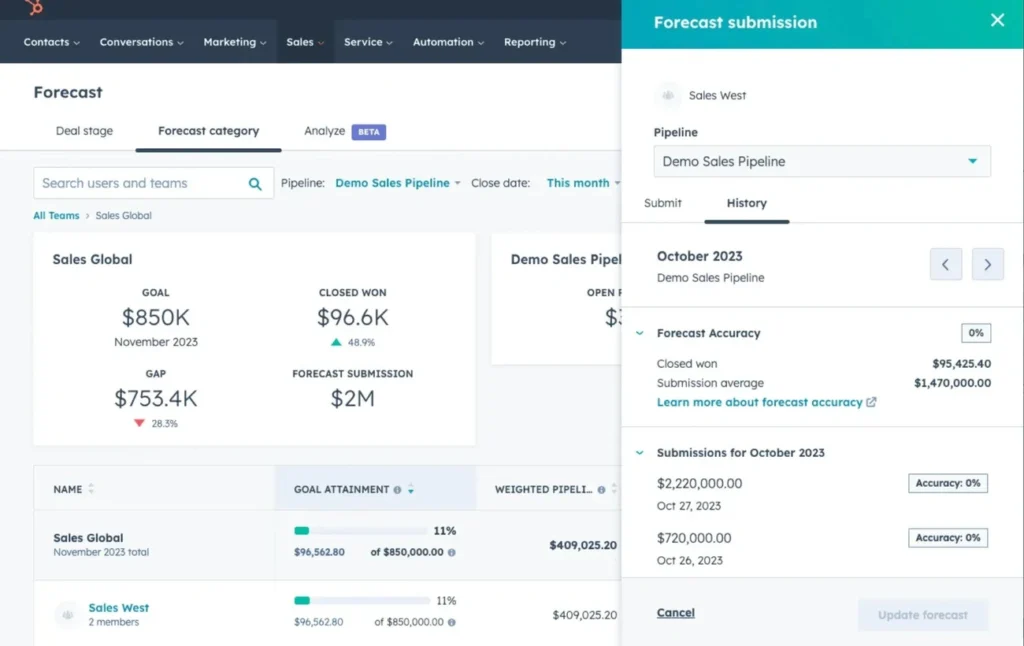
Image Source: HubSpot Blog
Simple historical trends sometimes fall short for accurate predictions. Regression analysis provides a more sophisticated mathematical approach to sales forecasting.
Regression Analysis: What it is
Regression analysis is a statistical method that shows relationships between a dependent variable (typically your sales) and one or more independent variables (such as marketing spend, pricing, or economic conditions). This technique measures how different factors affect your sales performance and helps you determine which variables matter and which you can ignore.
Regression analysis breaks down variables into two types:
- Dependent variable: The outcome you want to predict (your sales figures)
- Independent variables: Factors that might affect your dependent variable
Linear regression, the simplest form, uses a single straight line to show the relationship between sales and one independent variable through this equation: Sales = a + bX. ‘a’ represents the intercept, ‘b’ is the slope, and ‘X’ is the independent variable. A predictive model emerges if sales increase by $100,000 for every $10,000 spent on marketing.
Advanced versions include:
- Multiple regression analysis: Uses multiple independent variables to predict a single dependent variable
- Multivariate regression: Involves multiple dependent and independent variables
- Logistic regression: Models probability of binary outcomes
Regression Analysis: Why it works
Regression analysis works because it identifies and measures cause-and-effect relationships in your sales data. You learn exactly why sales increased and by how much, rather than just noting the increase.
Hidden patterns emerge that aren’t obvious right away. To cite an instance, see how analyzing sales success factors might show that adding marketing staff consistently results in more closed opportunities. Just generating more leads without extra support staff barely moves the needle.
Data-driven decisions replace intuition and guesswork. Marketing efforts become more accurate and strategic, which improves efficiency and cost-effectiveness. Companies get better results with the same or fewer resources.
Regression analysis helps in key business areas:
- Finding marketing channels with the highest ROI
- Setting optimal price points for maximum revenue
- Learning about product features’ effect on customer satisfaction
- Identifying variables that accelerate business growth
Regression Analysis: When to use it
Regression analysis shines in specific scenarios where you need deeper insights beyond simple historical patterns.
You should use regression analysis to get detailed, quantitative knowledge about sales influences and how to adjust them. Businesses that need to understand complex relationships between variables find this technique invaluable.
These situations call for regression analysis:
- Precise forecasting needs: Companies that need very accurate predictions benefit from regression’s mathematical rigor. This explains why the predictive analytics market grows faster as businesses look for precise forecasting tools.
- Marketing investment optimization: Regression analysis shows exactly how marketing spending affects sales outcomes, which helps allocate budgets better.
- Multiple factor analysis: Regression helps isolate each factor’s specific effect when sales depend on many variables like pricing, seasonality, and competition.
- Product development choices: Understanding how product features affect customer satisfaction helps prioritize improvements that boost sales.
- Price strategy analysis: Regression analysis reveals how price changes affect sales volume, which helps set optimal price points.
Statistical expertise and a complete understanding of your company’s sales influences are essential for successful regression analysis. The learning curve is worth it because proper regression analysis can dramatically improve your forecasting accuracy and strategic decisions.
Time Series Forecasting
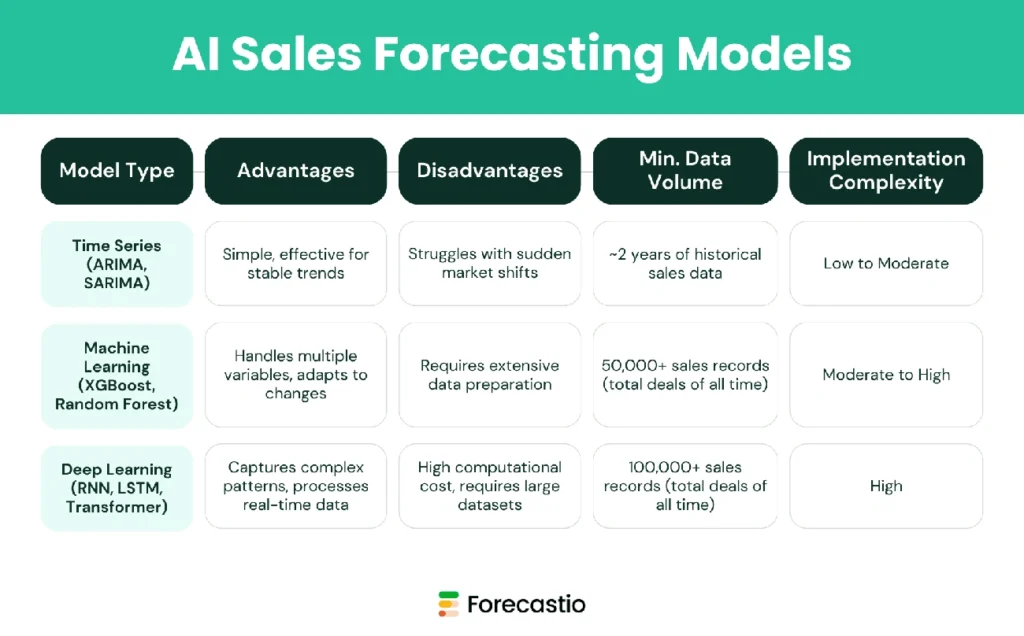
Image Source: Forecastio
Sales data contains hidden patterns that reveal future performance trends. Time series forecasting helps us discover these patterns and can cut forecast error rates by up to 60%.
Time Series Forecasting: What it is
Time series forecasting uses statistical methods to analyze data points collected at regular time intervals to spot patterns, trends, and relationships. This technique lets us infer future values from historical sales data based on the idea that past behavior predicts future outcomes.
Unlike other methods, time series analysis takes into account how data changes over time, recognizing that the order and timing of observations matter. The model breaks down your sales data into four key components:
- Trend: The enduring direction of your business
- Seasonality: Predictable surges and slowdowns
- Cycles: Multi-year waves driven by market forces
- Noise: Random fluctuations that need filtering
This sales forecasting model utilizes millions of historical action-outcome pairings to create probability curves that guide predictions. Popular approaches include ARIMA (AutoRegressive Integrated Moving Average), SARIMA (Seasonal ARIMA), exponential smoothing, and the Holt-Winters method.
Time Series Forecasting: Why it works
Time series forecasting captures the natural rhythm of business cycles. We spotted recurring patterns that human analysis might miss, which helps businesses prepare for familiar spikes like holiday shopping or end-of-quarter boosts.
The model’s success comes from knowing how to separate random fluctuations from genuine business trends. By filtering out noise, it reveals the true structure of sales data. Time series forecasting gets better as more data accumulates, larger historical datasets lead to more accurate predictions.
Revenue leaders in businesses of all types face three core challenges that time series forecasting addresses:
- Manual forecasting complexity: Time series models process thousands of data points at once while coordinating forecasts across territories or product lines. This maintains accuracy as your sales organization grows
- Seasonal and cyclical variance: The model builds seasonal cycles into baseline projections, showing you normal seasonal behavior
- Early risk detection: The models flag statistical variations earlier in the sales cycle, unlike manual forecasting that spots problems after deals slip
Time Series Forecasting: When to use it
Time series forecasting proves most valuable in scenarios where chronological patterns drive your sales behavior.
This approach works best when your business shows consistent, repeating sales patterns. Retailers can anticipate back-to-school or holiday demand spikes. B2B companies can predict quarter-end budget flushes or summer slowdowns.
You’ll need substantial historical data, at least two years of consistent sales records from your CRM system. The forecast’s time horizon matters too. Shorter time horizons typically yield more accurate predictions with higher confidence than longer ones.
On top of that, it excels in stable markets where external conditions stay consistent. Your forecasting opportunities grow as more data becomes accessible, offering better options for exploratory analysis, model testing, and forecast accuracy.
Time series forecasting shines when you just need frequent prediction updates. The forecasts refresh dynamically as new data arrives, which leads to better accuracy over time. Businesses that require weekly or monthly forecast updates to guide decisions will find this especially useful.
While time series forecasting offers great precision, it has limits. The model assumes past patterns will continue, making it nowhere near as reliable during major market disruptions or unprecedented events. You also need clean, consistently collected data with minimal gaps or anomalies to implement it successfully.
AI-Powered Forecasting
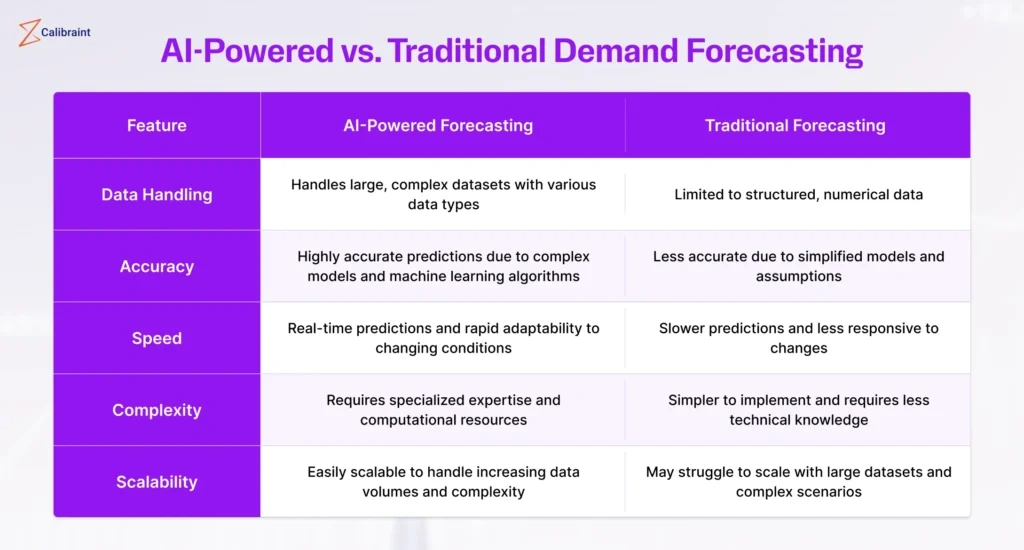
Image Source: Calibraint
Businesses today make use of artificial intelligence to turn uncertain forecasts into clear, practical revenue predictions. AI-powered forecasting stands at the forefront of sales prediction technology and delivers remarkable accuracy.
AI-Powered Forecasting: What it is
AI-powered forecasting blends artificial intelligence and machine learning algorithms with your CRM to analyze huge datasets and predict future sales trends. The system looks at multiple factors at once, past performance, customer behavior, market conditions, and external economic indicators, to create predictions that keep getting better.
The core technology behind AI sales forecasting has:
- Machine learning algorithms that spot patterns and improve predictions with new data
- Deep neural networks like long short-term memory (LSTM), gated recurrent units (GRU), and convolutional neural networks (CNN)
- Natural language processing that learns from customer interactions
- Predictive analytics that show which deals need quick attention
These systems remove guesswork by looking through large datasets to find trends humans might miss. They factor in variables like market conditions, customer buying behaviors, and past performance.
AI-Powered Forecasting: Why it works
AI-powered sales forecasting works because it processes information at scale and learns from outcomes. Companies using AI-driven forecasting have seen their forecast errors drop by 15-20% compared to traditional methods. Some organizations reach 95%+ forecast accuracy and save 30 hours each week on manual work.
The business results speak volumes 83% of sales teams with AI saw revenue growth last year, while only 66% of teams without AI did. This explains why 87% of SMB leaders say AI helps them grow their businesses.
AI-powered forecasting succeeds because it:
- Analyzes unstructured data from multiple sources
- Finds hidden connections between variables
- Updates predictions as new information comes in
- Uses evidence-based insights instead of human bias
- Takes care of routine forecasting tasks
The system helps teams know which deals need immediate attention and which can wait. Sales managers can put their best people on valuable opportunities. The system sends early warnings when deals slow down or customers lose interest. It suggests specific actions like follow-up emails or meetings to bring back hesitant buyers.
AI-Powered Forecasting: When to use it
Your organization should use AI-powered forecasting in complex sales environments where multiple factors affect outcomes. This approach proves valuable when you need:
Better forecast precision just 7% of sales organizations hit 90% or higher forecast accuracy. AI can improve results if your company doesn’t deal well with accurate predictions.
AI forecasting makes sense for businesses managing global supply chains or working in markets with high customer expectations and quick product lifecycles. Traditional forecasting methods hit their limits in these situations, but AI excels by using up-to-the-minute market signals.
Companies need enough historical data at least 12 months of sales records to make AI forecasting work. AI models can’t create reliable insights without enough data to analyze.
AI fits best when you want to automate routine forecasting tasks. Sales professionals save 18-22 hours weekly by letting AI handle repetitive outreach and administrative work. This gives your team more time to build relationships and close deals.
Opportunity Stage Forecasting
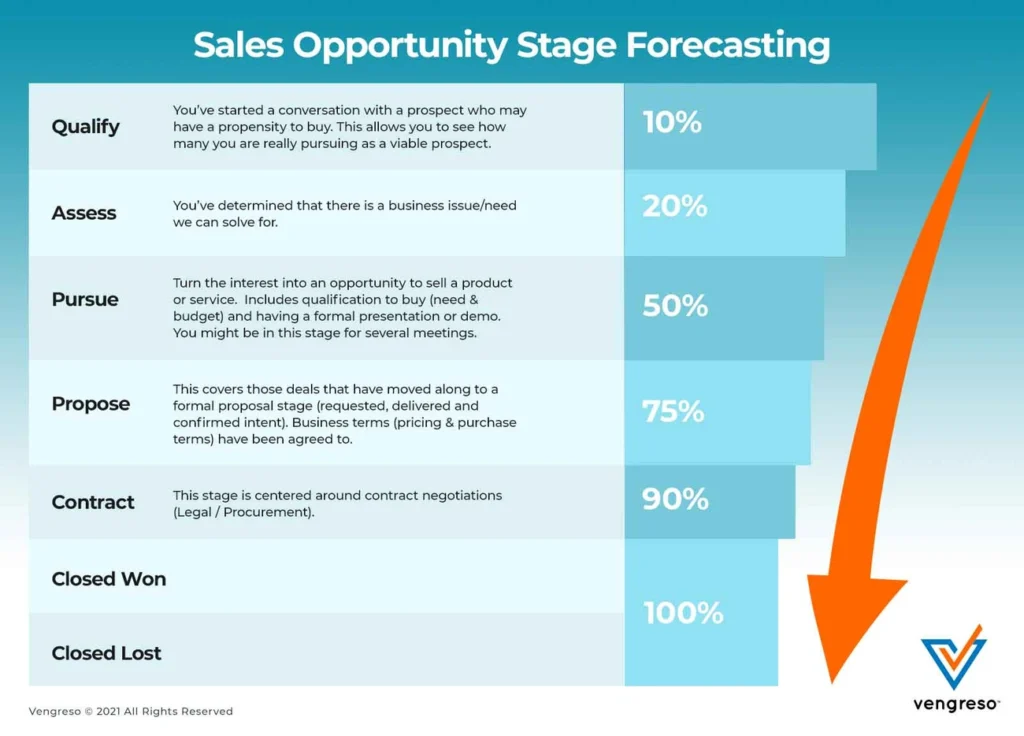
Image Source: Vengreso
Sales teams can turn their sales funnel into a powerful predictive tool through opportunity stage forecasting, a sales forecasting model that puts pipeline management front and center.
Opportunity Stage Forecasting: What it is
Your sales pipeline stages help predict revenue through opportunity stage forecasting. This method evaluates deals based on their current position and assigns specific probabilities to each stage. The sales process breaks down into clear stages from the first contact to closing and calculates likely outcomes as deals move through these phases.
The approach works simply yet effectively. Sales teams:
- Define clear pipeline stages (prospect, qualification, proposal, negotiation, etc.)
- Assign probability percentages to each stage based on historical close rates
- Multiply each opportunity’s value by its stage probability
- Sum the weighted values to create the forecast
To name just one example, a $100,000 deal in the proposal stage with a 45% probability of closing adds $45,000 to your forecast. The probability increases as deals progress through your pipeline, so their contribution to your forecast grows.
Opportunity Stage Forecasting: Why it works
A structured approach to deal assessment makes this sales forecasting methodology powerful. Research shows companies with structured sales processes are 33% more likely to be high performers. This structure gives sales teams a shared language to discuss deals and ensures everyone stays aligned from individual reps to top management.
The method creates an objective understanding of each pipeline stage. Sales leaders can assess team performance and spot areas that need improvement. Companies see a 23% improvement in forecast accuracy when they enforce strong opportunity exit criteria.
Sales managers get better revenue visibility by calculating pipeline health with up-to-the-minute data. They spot bottlenecks, stalled deals, or trouble spots right away. Companies that carefully manage stage progression see a 32% improvement in deal velocity and close bigger deals faster.
The method also helps allocate resources more precisely. Companies can focus on deals most likely to close by understanding their success probability.
Opportunity Stage Forecasting: When to use it
Specific business scenarios make this model most effective. You need a well-documented sales process with clear stage definitions. Without these definitions, probability assignments become random and forecasts lose accuracy.
This approach works best if you want an objective view of each sales pipeline stage. You can evaluate your sales team’s performance and find real areas for improvement as prospects move through your funnel.
Companies with substantial historical data about lead activities benefit most from this methodology. The method gives you a bird’s eye view of sales activities rather than detailed timing predictions since it doesn’t track how long leads spend at particular stages.
The flexibility of opportunity stage forecasting makes it useful for businesses of all sizes, from those handling average contract values under $15,000 to enterprises managing $50,000+ deals. Sales teams just starting with forecasting often choose this technique because it’s straightforward to use.
Lead-Driven Forecasting
Image Source: eSwap
Quality leads are the foundations of accurate revenue predictions. Lead-driven forecasting is a methodology that turns your sales funnel inputs into predictive insights.
Lead-Driven Forecasting: What it is
Your sales pipeline leads and their historical conversion rates help predict future revenue through lead-driven forecasting. This sales forecasting model looks at both quality and quantity of leads at each funnel stage to assess potential outcomes.
A simple mathematical formula makes this work: Forecast = Number of Leads × Conversion Rate × Average Deal Size
To cite an instance, you have 1,000 leads with a 10% close rate and an average deal size of $20,000. Your forecast would be $2 million. The life-blood of accurate predictions comes down to lead quality. Scoring criteria usually includes:
- Lead source (webinars, free trials, content downloads)
- Prospect engagement level (high, medium, low)
- ICP fit (excellent, good, poor)
Lead value calculations take this approach further. Each lead’s sales value multiplied by its conversion probability shows exactly what each prospect means to your pipeline.
Lead-Driven Forecasting: Why it works
Lead-driven forecasting shines because it shows your sales pipeline’s true health. Companies create more accurate revenue projections by giving each lead a closing probability based on its source, engagement level, and past conversion rates.
Sales teams can focus on the most promising leads with this methodology. Evidence-based resource allocation decisions become possible. A SaaS company might find that demo request leads convert at 30% and close at $2,000, giving them a lead value of $600 each. Meanwhile, advertising leads convert at only 10% with a $1,000 value, worth just $100 each.
Lead-Driven Forecasting: When to use it
We implemented this sales forecasting methodology with mature CRM systems and well-defined sales cycles. Companies with high lead volumes and detailed tracking of lead quality and conversion rates see exceptional results.
Digital marketing agencies and SaaS companies find value in this method through their strong lead generation processes. Companies that set clear criteria to qualify leads and assign them to funnel stages get the best results.
Sales and marketing teams need to work together closely. They must optimize based on lead generation campaign data continuously. The system becomes nowhere near reliable without detailed data and well-laid-out scoring criteria.
Multivariable Analysis Forecasting
Image Source: Expandi
Today’s complex business environments just need forecasting that takes multiple influencing factors into account at once. Multivariable analysis forecasting delivers this with remarkable accuracy.
Multivariable Analysis Forecasting: What it is
Multivariable analysis forecasting reveals relationships between three or more variables to predict future sales outcomes. This sophisticated method blends various data sources from historical sales figures to social media trends, economic indicators, and customer behaviors to create detailed sales projections. The process mirrors the scientific method: observing effects, hypothesizing about causes, testing, and gathering data to verify.
Multivariable analysis goes beyond simple forecasting by incorporating both quantitative and qualitative factors. The method assesses elements such as:
- Sales cycle length for different types of deals
- Deal closure likelihood based on specific factors
- Team member performance metrics (win rates, quota attainment)
- Economic indicators (GDP, inflation, consumer spending)
- Marketing effectiveness in each channel
Multivariable Analysis Forecasting: Why it works
Multivariable analysis shines through its power to capture complex interactions between different sales performance factors. Tackle.io shows this effect, they switched from spreadsheet-based forecasting to a multivariable approach using over 300 data points. The result was highly accurate forecasts and 40% less time spent on forecasting.
| Pros | Cons |
|---|---|
| Assesses multiple factors for higher accuracy | Requires extensive data and sophisticated tools |
| Suitable for both short and long-term forecasts | Complex and time-consuming implementation |
This approach helps businesses grasp the real reasons behind sales trends and optimize operations effectively. The method also uncovers patterns and relationships that other analyzes might miss, offering deeper strategic insights.
Multivariable Analysis Forecasting: When to use it
Multivariable analysis forecasting works best when multiple independent factors shape your sales outcomes. This method proves most valuable in:
- Hyper-growth scenarios where basic methods fall short
- Complex markets with numerous variables affecting buying decisions
- Cases requiring detailed understanding of sales drivers
- Situations where simple or weighted averages lack accuracy
Success depends on sophisticated analytics tools that can process complex data relationships. The model’s effectiveness drops without proper technological support and clean data, whatever its theoretical potential might be.
Comparison Table
| Forecasting Model | Key Components/Features | Main Benefits | Best Use Cases | Reported Accuracy/Performance |
|---|---|---|---|---|
| Historical Data Analysis | – Past sales trends analysis – Pattern identification – Seasonality tracking – Growth path analysis | – Based on real results – Uncovers hidden patterns – Helps evaluate risks – Better resource planning | – Mature businesses – Stable markets – Seasonal pattern analysis – Setting sales targets | Needs at least 1 year of data for reliable standards |
| Regression Analysis | – Dependent variable (sales) – Independent variables (marketing, pricing, etc.) – Mathematical relationships – Statistical modeling | – Shows cause-effect links – Uncovers hidden patterns – Enables informed decisions – Measures variable effects | – Precise forecasting needs – Marketing spend optimization – Multiple factor analysis – Pricing strategy analysis | Not specifically mentioned |
| Time Series Forecasting | – Trend analysis – Seasonal patterns – Cyclical elements – Noise filtering | – Captures business cycles – Separates trends from changes – Spots risks early – Works with complex data | – Businesses with recurring patterns – Stable markets – Regular forecast updates – 2+ years of past data | Can reduce forecast errors by up to 60% |
| AI-Powered Forecasting | – Machine learning algorithms – Neural networks – Natural language processing – Predictive analytics | – Better accuracy – Immediate updates – Removes human bias – Automates tasks | – Complex sales settings – Global supply chains – Data-rich organizations – High-volume sales | – 15-20% fewer forecast errors – 95%+ accuracy in some cases |
| Opportunity Stage Forecasting | – Pipeline stage definitions – Stage probability assignments – Value weighting – Progress tracking | – Well-laid-out approach – Fair assessment – Better revenue visibility – Smarter resource use | – Well-documented sales processes – Clear stage definitions – Substantial past data – Businesses of all sizes | 33% more likely to perform better |
| Lead-Driven Forecasting | – Lead quantity analysis – Conversion rate tracking – Lead quality scoring – Value calculations | – Clear pipeline health view – Smarter lead focus – Informed resource use – Exact value assessment | – Mature CRM systems – High lead volumes – Digital marketing agencies – SaaS companies | Example: 30% conversion for demo requests vs 10% for ad leads |
| Multivariable Analysis | – Multiple data source integration – Quantitative/qualitative factors – Complex relationship analysis – Performance metrics | – Detailed insights – Pattern spotting – Helps plan strategy – More accurate results | – Fast-growth scenarios – Complex markets – Multiple sales drivers – Advanced analytics needs | 40% less forecasting time (Tackle.io case) |
Conclusion
Sales forecasting accuracy gives modern businesses a vital competitive edge. This piece explores seven proven forecasting methods that provide solutions for almost any sales environment. Each model adds unique strengths to your revenue prediction toolkit. You might need solid historical data analysis or sophisticated AI-powered forecasting pattern recognition.
Businesses struggling with forecast accuracy now have clear paths forward. Your specific situation determines which model works best. Stable markets benefit from time series forecasting. Complex environments with multiple variables need multivariable analysis or AI-powered solutions.
Most successful organizations combine multiple forecasting methods instead of using just one approach. This hybrid strategy helps sales teams confirm predictions and balance individual model limitations. Teams can reduce forecast error rates by up to 60%. Better resource allocation, precise budgeting, and fewer revenue surprises follow naturally.
Sales forecasting evolves faster as AI and machine learning technologies mature. These advances make sophisticated forecasting capabilities accessible to more people, not just enterprise-level organizations. Small and mid-sized businesses can now utilize these tools to compete better.
Your next steps should evaluate current forecasting practices against these proven models. Think over your business needs, data availability, and team capabilities when picking the right approach. Note that even small improvements in forecast accuracy can bring substantial business benefits through better decisions and resource optimization.
Evidence-based sales forecasting turns uncertainty into strategic advantage. These proven methods will position your organization for greater predictability, profitability, and long-term success in an increasingly competitive marketplace when you start using them today.
Key Takeaways
These seven proven sales forecasting models can transform your revenue predictions from guesswork into strategic advantage, with some methods cutting error rates by up to 60%.
• Historical data analysis works best for established businesses – Requires at least one year of data and excels in stable markets with seasonal patterns
• AI-powered forecasting delivers the highest accuracy gains – Reduces forecast errors by 15-20% on average, with some organizations achieving 95%+ accuracy
• Time series forecasting cuts error rates by up to 60% – Ideal for businesses with repeating patterns and at least two years of historical data
• Opportunity stage forecasting improves performance by 33% – Companies with structured sales processes are significantly more likely to be high performers
• Combine multiple methods for maximum effectiveness – Most successful organizations use hybrid approaches rather than relying on single forecasting models
The key to success lies in matching your forecasting method to your business situation, stable markets benefit from historical analysis, while complex environments require AI or multivariable approaches. Start by evaluating your current practices against these proven models to unlock better resource allocation, precise budgeting, and fewer revenue surprises.
FAQs
Q1. What is considered the most effective sales forecasting model? While there are several effective models, AI-powered forecasting tends to deliver the highest accuracy gains, reducing forecast errors by 15-20% on average. Some organizations have achieved over 95% accuracy using AI-driven forecasting tools.
Q2. How can businesses improve their sales forecast accuracy? Businesses can significantly improve forecast accuracy by combining multiple forecasting methods rather than relying on a single approach. This hybrid strategy allows for cross-validation of predictions and can help compensate for individual model limitations.
Q3. Which forecasting method works best for businesses with seasonal sales patterns? Time series forecasting is particularly effective for businesses with repeating seasonal patterns. It can cut error rates by up to 60% and is ideal for companies with at least two years of historical data.
Q4. How does opportunity stage forecasting impact sales performance? Opportunity stage forecasting can improve sales performance by up to 33%. Companies that implement structured sales processes and clearly defined pipeline stages are significantly more likely to be high performers in their industry.
Q5. What should businesses consider when choosing a sales forecasting method? Businesses should evaluate their current forecasting practices against proven models, considering factors such as their specific business needs, data availability, and team capabilities. The choice of method should align with the company’s market stability, complexity of sales environment, and available historical data.