How Big Data Predictive Analytics Actually Works (With Real Examples)

Predictive Analytics is changing the way businesses make decisions. The market has grown from $5.29 billion in 2020 and experts project it to reach $41.52 billion by 2028. This remarkable growth shows how crucial this technology( Big Data Predictive Analytics ) has become in any discipline.
Many businesses face challenges with traditional data analysis methods that fail to connect different data sources. Predictive analytics turns passive information into proactive insight, which lets companies move from reactive analysis to immediate forecasting. Big data systems make this process more powerful because larger data pools substantially boost data mining capabilities.
This piece will help you learn about predictive analytics, its process, and the statistical models behind these insights. On top of that, it explains how predictive data analysis helps with informed decision-making, risk management, optimization, and tailored customer experiences. You’ll find real-life examples that show how businesses make use of these technologies to stay ahead in today’s digital world.
Table of Content
What is Predictive Analytics in Big Data?
Predictive analytics combines historical data with statistical modeling, data mining, and machine learning to forecast future outcomes. This branch of advanced analytics looks forward, unlike other business intelligence technologies, and uses past events to anticipate what might happen next.
Definition of predictive analytics and its role in data science
Statistical techniques from data mining and machine learning form the foundation of predictive analytics. These techniques analyze current and historical facts to predict future or unknown events. Data science uses predictive analytics as the life-blood of precision medicine and other fields where outcome prediction is vital. The process captures relationships between explanatory variables from past events and uses them to predict unknown outcomes.
Big Data Predictive Analytics (BDPA) creates frameworks that gather, analyze, and interpret data. These frameworks work with data characterized by variety, volume, velocity, veracity, and value to identify patterns and relationships that forecast future events.
How big data enables predictive analytics at scale
Predictive analytics has transformed from theory to real-life application thanks to big data. Data scientists can now analyze massive datasets without restriction, unlike earlier times when statisticians worked with limited sample sets. Organizations have moved from hypothesis-based approaches to data-first strategies, letting information guide their direction.
Big data’s integration with predictive analytics has become one of the most significant developments. This combination shapes how organizations extract value from their data capabilities. Three main factors drive this possibility:
- Digital capabilities have transformed data from batch processing to up-to-the-minute, always-available access
- Volume and variety of data sources provide enough size to enable meaningful learning
- Agility in processing lets organizations experiment and learn faster
Difference between predictive analytics and traditional analytics
Traditional analytics looks at past events, while predictive analytics prepares for future possibilities. Machine learning algorithms analyze huge amounts of data from multiple sources, taking forecasting beyond traditional methods that only understand historical patterns.
Predictive analytics improves accuracy, handles larger datasets, and adapts to new information better than traditional methods. The system identifies complex patterns beyond linear correlations and estimates likely future outcomes with greater precision instead of just reporting past events.
Step-by-Step Predictive Analytics Process
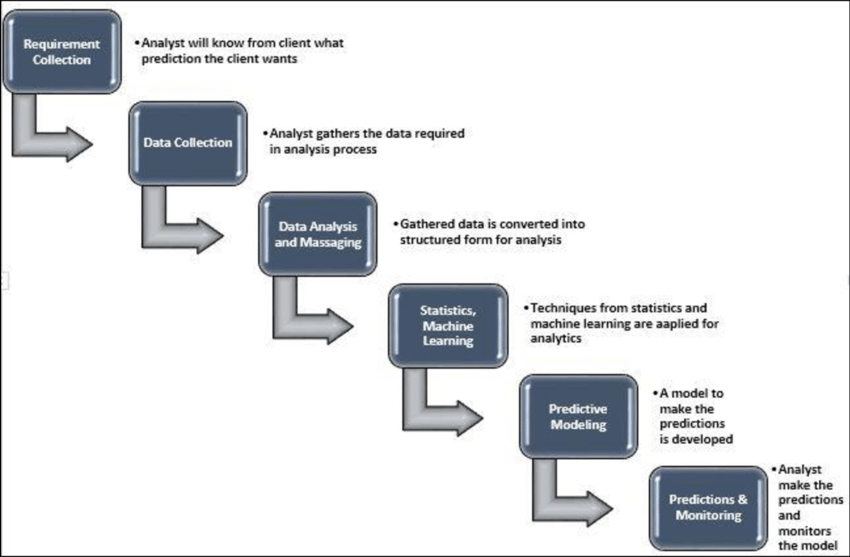
Image Source: ResearchGate
A well-laid-out approach leads to successful predictive analytics in big data. The systematic process will give a solid foundation for accurate predictions that provide useful business insights.
1. Define the business problem
The predictive analytics process starts when you clearly state what needs solving. Every prediction needs a strong thesis and requirements. The first vital step creates a list of questions ranked by priority. To name just one example, you might need to detect fraud, set optimal inventory levels, or predict flood levels from severe weather. Your choice of predictive analytics method depends on having a clear problem definition.
Success criteria and metrics must measure the effects of proposed solutions during this phase. It’s worth mentioning that you should evaluate how decision-makers will use these predictions and why.
2. Collect and organize historical data
After setting objectives, you need to identify and gather relevant data. Many organizations have decades of records or steady streams of information from customer interactions. Data flows from many sources like transactional databases, CRM systems, web analytics, and IoT devices.
Data needs organization in repositories like data warehouses before model development can begin. This stage takes time but remains significant to success. Your organization needs enough quality data, sometimes existing records might not meet specific objectives.
3. Preprocess and clean the data
Raw data alone serves little purpose. The preprocessing stage removes anomalies, handles missing values, and fixes extreme outliers from input or measurement errors. Clean, consistent, and model-ready data emerges from this process.
Standard preprocessing methods include:
- Outlier and missing-value removal
- Noise reduction through filtering or smoothing
- Transformations between time and frequency domains
4. Build predictive analytics models
Data scientists select appropriate techniques based on the problem and dataset after data preparation. They choose suitable algorithms, train models using historical data, and adjust parameters.
The toolkit includes regression models for continuous outcomes, classification techniques for categorical predictions, and time series models that forecast trends.
5. Validate and deploy the model
The final stage tests the model’s accuracy and makes needed adjustments. Testing with new, unseen data confirms the model works well beyond just training data. Methods like k-fold cross-validation or time-series validation help estimate the model’s effectiveness.
Models that show good results can reach stakeholders through apps, websites, or data dashboards. Regular monitoring becomes essential since performance changes happen due to shifts in customer sentiment, business climate, or other factors.
Popular Predictive Analytics Models and Techniques
Predictive analytics uses many mathematical models and techniques to find patterns in data. Each model type has its own purpose. Some predict numbers while others spot complex relationships in datasets.
Regression models for continuous outcome prediction
Regression models link independent and dependent variables to predict numerical outcomes. Linear regression shows how changes in independent variables affect a dependent variable. It creates a straight-line relationship that reduces differences between data points and the fitted line. This method works best with continuous data that has linear relationships between inputs.
Logistic regression estimates probabilities using a logistic function, though it’s actually a classification algorithm. Both methods let organizations run “what-if” scenarios by testing new independent variables to see their impact on outcomes.
Companies use regression models to predict customer value, house prices, and future sales. These models are simple to understand and interpret. That’s why they’re usually the first choice for continuous prediction problems.
Classification models like decision trees and SVM
Classification models sort data into specific groups based on past patterns. Decision trees show decision processes like a flowchart. Each node shows a feature, branches show decisions, and leaves show outcomes. Their user-friendly nature makes them great for customer segmentation and spotting fraud.
Support Vector Machines (SVM) work by finding a hyperplane that creates the biggest gap between different classes of data points. SVMs work well with high-dimensional spaces and handle non-linear relationships through the “kernel trick”.
Random Forest models combine multiple decision trees to create better results than single trees. These models help assess credit risk, detect fraud, and support medical diagnosis.
Clustering models for customer segmentation
Clustering puts similar data points into groups based on shared traits. This helps segment customers by finding natural groups without preset limits.
K-means clustering stands out as the most accessible algorithm. It splits data into K preset clusters. The algorithm tries to minimize the squared-error distance between points and their cluster centers. Retail and marketing teams use K-means to group similar customers for targeted strategies.
Other clustering methods include Gaussian Mixture Models (GMM) that capture data point distributions and reveal hidden customer behaviors. DBSCAN (Density-Based Spatial Clustering) spots clusters of different shapes and densities.
Time series models for forecasting trends
Time series models look at data changes over time to make predictions. These models work with specific time periods like days, weeks, or months to find seasonal patterns, trends, and cycles.
ARIMA combines autoregressive and moving average methods to predict future values from past observations. SARIMA extends this to handle seasonal patterns.
Exponential smoothing uses weighted averages of past data for short-term forecasts. Businesses predict sales, visitor numbers, and resource needs with these techniques. Good time series forecasts need clean, consistent data without big gaps.
Neural networks for complex pattern recognition
Neural networks mirror the human brain’s structure with connected layers of neurons that process input data. They have an input layer, hidden layers, and an output layer.
Each neuron calculates weighted input sums, applies an activation function, and sends results forward. This layered design lets neural networks learn complex patterns without explicit programming.
Neural networks handle many data types well, from text and images to time-series data. Convolutional Neural Networks (CNNs) work best with image-like data, while Recurrent Neural Networks (RNNs) process sequences.
Neural networks find relevant patterns straight from raw data without manual feature engineering. They scale well and adapt easily, making them perfect for complex predictions across many fields.
Real-World Examples of Predictive Analytics in Action
Big data predictive analytics creates measurable business value in many industries. Companies turn raw data into practical insights through real-life applications.
Fraud detection in banking and e-commerce
Banks and financial institutions use predictive analytics to spot suspicious patterns before money is lost. American Express saw a 6% improvement in fraud detection with advanced LSTM AI models. PayPal boosted its real-time fraud prevention by 10% by watching transactions worldwide. Banking systems look at customer behavior, what they buy, and device details to spot unusual transactions and stop unauthorized charges.
Customer churn prediction in telecom
Customer losses hit telecom companies hard losing just 1% of customers monthly can mean millions in lost revenue. SyriaTel used an XGBOOST algorithm-based predictive model that was 93.3% accurate in spotting customers who might leave. Another telecom system used random forest classification and reached 99% accuracy in predicting customer exits. This lets companies take action before customers switch to other providers.
Predictive maintenance in manufacturing
Smart manufacturers spot equipment failures before they happen. Oil companies that monitor their drilling equipment have cut maintenance costs by up to 38%. Car assembly lines collect millions of data points from welding guns that do 15,000 welds daily to predict failures. Steel processors watch vibration patterns to spot problems early, which has led to 60% longer equipment life.
Personalized medicine in healthcare
Healthcare providers make use of predictive analytics to tailor treatments to each patient. Doctors can spot high-risk patients before symptoms show up by looking at genetic, lifestyle, and environmental data. Predictive models check heart disease risks by looking at patient history and genetic factors. Hospitals can also find patients who might need to come back often and help prevent repeated stays.
Inventory forecasting in retail
Inventory problems cost retailers about $800 billion worldwide. Retailers use predictive analytics to move slow-selling products to stores where they’ll sell better. This helps companies sell items at full price instead of marking them down. Companies that use these methods report 25-40% lower inventory costs and 11-20% better sales. This shows how evidence-based inventory management helps boost profits.
Conclusion
Big data predictive analytics has changed how businesses use their past information to make future decisions. This article shows how companies in many industries use these powerful techniques. They solve complex problems and gain advantages over competitors. A clear process exists – from identifying business problems to implementing tested models. This gives companies a clear path to put predictive solutions to work.
Different analytical models meet various business needs. Sales figures can be predicted through regression techniques. Classification models work well to spot fraud. Customer segments emerge naturally through clustering approaches. Time series models track patterns needed for inventory planning. Neural networks excel at finding complex patterns in unstructured data without explicit programming.
The benefits of these approaches show up clearly in real examples. Banks save millions by spotting fraud patterns early. Telecom companies can spot 90% of customers who might leave. Manufacturing plants cut maintenance costs by 38% by predicting equipment failures. Healthcare providers create personalized treatments from patient data. Retailers boost sales while cutting inventory costs by 25-40%.
Companies that become skilled at prediction will lead tomorrow’s business world. Those who don’t use these methods risk falling behind competitors who better understand market changes and customer needs. Your business can join these forward-thinking organizations and turn data into strategic planning. You should ask experts to help guide you through this complex field. Schedule Your Predictive Analytics Consultation Today to find how these technologies can help with your specific business challenges.
Predictive analytics goes beyond technological progress. It marks a basic change from reacting to planning ahead. We now focus less on past events and more on what comes next and how to prepare. This forward-thinking approach, backed by solid data and smart models, helps businesses stay competitive in today’s market.
Key Takeaways
Big data predictive analytics transforms passive historical data into proactive business intelligence, enabling companies to forecast outcomes and make strategic decisions before events occur.
• Follow a structured 5-step process: Define business problems, collect historical data, preprocess information, build models, and validate before deployment for maximum accuracy.
• Choose the right model for your needs: Use regression for continuous predictions, classification for categorization, clustering for segmentation, and neural networks for complex patterns.
• Real ROI is achievable across industries: Companies report 25-40% reduced inventory costs, 93% fraud detection accuracy, and 38% lower maintenance expenses through predictive analytics.
• Start with clear business objectives: Success depends on defining specific problems and success metrics before diving into data collection and model building.
The predictive analytics market is projected to grow from $5.29 billion to $41.52 billion by 2028, reflecting how essential this technology has become for competitive advantage. Organizations that master these capabilities can shift from reactive analysis to strategic foresight, staying ahead in today’s data-driven landscape.
FAQs
Q1. How does big data enhance predictive analytics? Big data provides large volumes of diverse information that predictive analytics can leverage to identify patterns and make more accurate forecasts. This combination allows businesses to analyze vast datasets in real-time, enabling more precise and timely predictions.
Q2. What are the key steps in the predictive analytics process? The predictive analytics process typically involves five main steps: defining the business problem, collecting and organizing historical data, preprocessing and cleaning the data, building predictive models, and validating and deploying the model.
Q3. Which industries benefit most from predictive analytics? Predictive analytics has wide-ranging applications across various industries. Some key beneficiaries include banking (for fraud detection), telecommunications (for customer churn prediction), manufacturing (for predictive maintenance), healthcare (for personalized medicine), and retail (for inventory forecasting).
Q4. What types of predictive models are commonly used in big data analytics? Common predictive models include regression models for continuous outcome prediction, classification models like decision trees and SVM for categorization, clustering models for customer segmentation, time series models for forecasting trends, and neural networks for complex pattern recognition.
Q5. How can businesses measure the success of their predictive analytics initiatives? Businesses can measure the success of predictive analytics initiatives by tracking specific metrics related to their objectives. For example, they might look at improvements in fraud detection rates, reductions in customer churn, decreases in maintenance costs, or increases in sales due to better inventory management. It’s crucial to define clear success criteria and key performance indicators at the outset of any predictive analytics project.