Customer Lifetime Value Calculation: Step-by-Step Guide for SaaS Businesses
Did you know that in the SaaS industry, the ideal LTV to CAC ratio is 3:1?
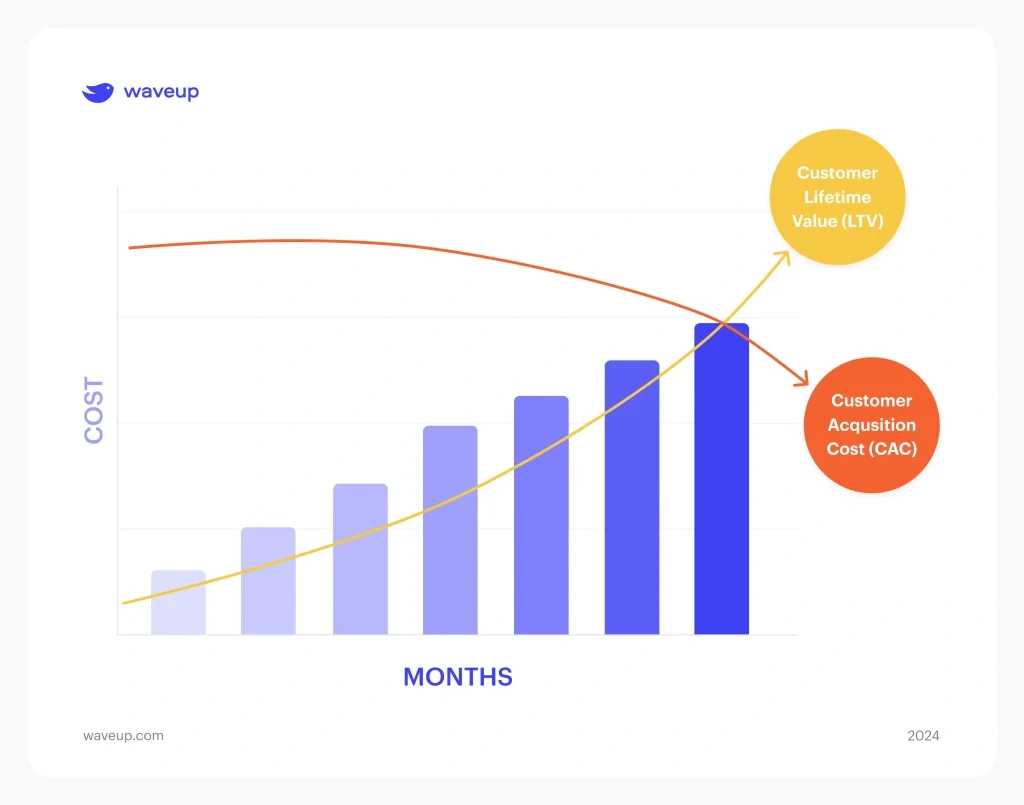
Your customer lifetime value calculation should show that average customers generate three times more revenue than your acquisition costs. A customer with a CAC of $100 and an LTV of $1,000 brings you $900 in profit.
Many SaaS businesses find this balance challenging. Your business loses money on each new customer when the LTV to CAC ratio drops below 1:1. A ratio above 3:1 might signal that you’re not investing enough in customer acquisition to propel development.
The stakes get higher since SaaS companies spend 5 to 7 times more to acquire new customers than to retain existing ones. Understanding how to calculate customer lifetime value for your SaaS business isn’t just helpful, you need it for sustainable growth.
Let’s break down the SaaS customer lifetime value calculation process step by step. We’ll give you the simple formulas and advanced techniques to measure customer value accurately and optimize your acquisition strategy.
What is Customer Lifetime Value in SaaS?
Customer lifetime value stands as the life-blood metric that makes the difference between thriving SaaS businesses and those barely surviving in today’s competitive world. Subscription businesses build value differently from traditional one-time purchase models, which makes this calculation vital.
Definition of LTV and CLV
Customer lifetime value (CLV or LTV) shows how much revenue or profit a SaaS company expects to earn from a customer throughout their relationship with the business. The calculation factors in projected revenue from each customer and subtracts costs needed to acquire and serve them.
The simple formula to calculate customer lifetime value is:
CLV = (Average Revenue Per User × Customer Lifespan) − Total Costs to Serve
To cite an instance, see a customer who spends $500 per month on your SaaS product and stays with your business for 12 months. Their lifetime value would be $6,000. This straightforward method lays the groundwork for more sophisticated lifetime value calculations we’ll explore later.
Why LTV matters for subscription businesses
SaaS companies value LTV beyond just financial tracking. The subscription model changes how you think about revenue your cash flow builds over time and ties each customer’s lifetime value directly to your bottom line. A customer’s $50 monthly payment over 24 months adds up to $1,200 instead of just $300. Small improvements in retention create substantial financial effects.
High customer lifetime value makes your business more competitive. More revenue from each customer and better gross margins give you room to reinvest in growth areas from customer experience to new breakthroughs. This creates a cycle where customer value stimulates further improvements.
LTV also works as a vital metric to measure financial sustainability. Short-term metrics like conversions or monthly revenue help, but they miss your business’s true long-term profitability. Looking at LTV over 4-5 years helps you track your company’s financial health.
Research shows that a 5% increase in customer retention rates can boost profits from 25% to 95%. Subscription businesses grow five times faster than traditional ones. This makes knowing how to understand and optimize LTV significant.
Difference between LTV and CLV
LTV and CLV often mean the same thing in SaaS conversations, but subtle differences exist depending on context. Customer Lifetime Value (CLV) looks at profit from specific customers over their lifetime. It factors in purchase frequency, average value, and customer lifespan.
Lifetime Value (LTV) might refer to non-customer entities’ lifetime value in broader contexts. SaaS companies use LTV to see the big picture of value from average customers. CLV helps understand value from specific customers or segments.
LTV reveals what all customers will bring in during their interaction period. It combines revenue potential from the entire customer base. CLV focuses on individual customer contributions during their relationship with your company.
These nuances aside, most SaaS discussions treat CLV and LTV as the same when talking about long-term customer value. Both metrics measure how customer relationships create lasting revenue.
How to Calculate Customer Lifetime Value
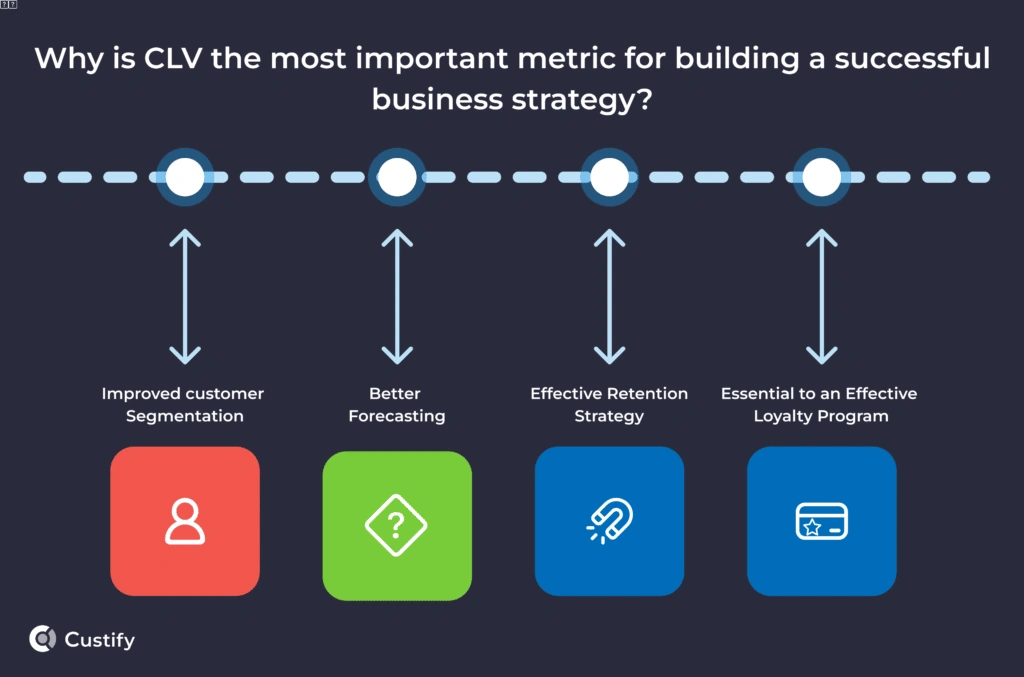
Image Source: Custify
SaaS companies need to know how much revenue their customers generate throughout their relationship. Let’s get into the quickest ways to figure this out using different formulas. Each formula gives you varying levels of accuracy based on your data and business model.
Simple formula: ARPU × Customer Lifetime
The basic customer lifetime value calculation needs two things: Average Revenue Per User (ARPU) and Customer Lifetime.
ARPU shows your revenue from each customer monthly. You can find it by dividing your Monthly Recurring Revenue (MRR) by your total users.
Customer Lifetime shows how long people stick with your business before they leave. The math is simple – divide 1 by your monthly churn rate. A 5% monthly churn rate means customers stay around for 20 months.
The formula looks like this: LTV = ARPU × Customer Lifetime
To name just one example, if customers pay $100 monthly and stay for 20 months, your LTV equals $2,000.
Churn-based formula: ARPU ÷ Churn Rate
A simpler approach uses churn rate directly: LTV = ARPU ÷ Churn Rate
This formula gives you the same answer as the first one without calculating customer lifetime separately. Your LTV would be $2,000 with a $100 ARPU and 5% monthly churn rate.
The math works because customer lifetime equals 1 divided by churn rate. ARPU × (1/Churn Rate) becomes ARPU ÷ Churn Rate.
Gross margin formula: (ARPU × Gross Margin) ÷ Revenue Churn
Many SaaS companies want a better picture of their profits, so they add gross margin: LTV = (ARPU × Gross Margin) ÷ Revenue Churn Rate
Gross margin is what’s left after subtracting the cost of goods sold (COGS). SaaS businesses’ COGS usually has hosting fees, customer support costs, and third-party software licenses.
Revenue churn is different from customer churn. It measures lost revenue percentage in a period: (Revenue lost – Upsells) ÷ Revenue at beginning of period.
This formula shows value better because revenue impacts vary. A customer paying $1,000 monthly with 80% gross margin brings more value than one paying $1,200 with 60% margin.
Using analytics tools for LTV calculation
Manual calculations become harder as you grow. Analytics tools can do the math for you and give you deeper insights through:
Historical analysis: Shows real patterns from past customer behavior.
Predictive modeling: Uses machine learning to see future customer value based on behavior.
Cohort analysis: Groups customers by when they joined to spot value trends.
These tools help you split customers into groups based on behavior or demographics. You’ll learn which customers bring the most value and can focus your efforts on getting and keeping similar ones.
Analytics tools let you play with different variables and discount rates. Premium SaaS businesses often use 10-15% discount rates in LTV calculations to account for money’s time value.
Regular monitoring of these calculations helps you learn about what works. You can optimize your growth through better customer acquisition and retention strategies.
Understanding the LTV to CAC Ratio
The LTV to CAC ratio is a vital indicator of financial health for SaaS companies. It shows if your customer acquisition spending creates lasting value or wastes resources.
What is CAC and how to calculate it
Customer Acquisition Cost (CAC) measures how much a company spends to get a new customer. This metric includes all sales and marketing expenses during a specific period divided by the number of new customers acquired in that same timeframe.
The formula for calculating CAC is:
CAC = Total Sales and Marketing Expenses ÷ Number of New Customers Acquired
Your CAC calculation should include all acquisition-related expenses:
- Advertising spend
- Marketing team salaries and commissions
- Sales team compensation
- Marketing automation tools
- Content creation costs
- Professional services like consultants
LTV:CAC ratio formula and benchmarks
The LTV:CAC ratio compares your customers’ lifetime value against their acquisition costs:
LTV:CAC Ratio = LTV ÷ CAC
SaaS businesses should aim for a 3:1 ratio, which means your customer’s lifetime value should be at least three times their acquisition cost. This target shows your business has achieved sustainable unit economics.
Different industries have their own benchmarks:
- AdTech leads with 7:1
- Most SaaS sectors range from 4:1 to 6:1
- Business Services and Industrial sectors target 3:1
A ratio below 1:1 means you’re losing money spending more on customer acquisition than generating revenue. Ratios between 1-3:1 show sustainability but leave room for improvement. Anything above 5:1 might mean you’re not investing enough in growth.
Why this ratio matters for SaaS growth
The LTV:CAC ratio answers a fundamental question: Is your business model viable? It shows if customers generate more profit than their acquisition costs. This metric reveals several key insights.
Your company’s profitability becomes clear when customer lifetime value exceeds acquisition costs. A good ratio shows you can get customers efficiently and generate substantial revenue from them.
The ratio also affects your company’s value. Research shows that improving your LTV:CAC from 2:1 to 3:1 can almost triple your valuation.
A healthy ratio lets you reinvest in customer acquisition strategies. This creates a positive cycle that supports lasting growth. Companies with strong ratios can grow their customer base more effectively.
The CAC recovery period plays a crucial role too. Healthy SaaS companies usually recover acquisition costs within 12 months. Top performers achieve this in 5-7 months.
Key Metrics That Influence LTV
Several metrics directly affect your saas customer lifetime value calculation. Learning about these metrics gives practical insights to grow your business sustainably and maximize revenue from each customer relationship.
Monthly Recurring Revenue (MRR)
MRR works as the total predictable revenue from all active subscriptions in a specific month. This metric includes subscription fees, recurring charges, and other predictable revenue streams that are the foundations of your SaaS business.
MRR is not just a number, it stimulates growth and shows your business’s financial health. Tracking MRR with customer lifetime value calculation helps you learn about:
- Revenue stability and growth path
- Customer satisfaction patterns
- How well retention strategies work
MRR helps you make smart decisions about scaling, staffing, and investing in new features based on income patterns you can predict. You can strategically adjust customer success efforts when you identify different MRR types (New MRR, Expansion MRR, Churned MRR).
Average Revenue Per User (ARPU)
ARPU shows how much revenue each customer brings over a specific timeframe. You can calculate it by dividing your total MRR by active users. To cite an instance, if your total MRR is $186,380 with 2,716 active users, your ARPU would be $68.62.
ARPU affects your lifetime value calculation saas formula because higher per-customer revenue naturally increases overall customer value. It also helps you:
- Make pricing strategies better
- Find upselling opportunities
- Group customers by spending habits
Churn Rate and Retention
Churn rate shows the percentage of customers who cancel or stop using your product in a specific period. Retention rate shows those who stay. These metrics determine customer lifespan and then lifetime value.
Churn and LTV have an inverse relationship, small churn changes dramatically affect customer worth. These numbers show the impact:
- 5% monthly churn results in a $2,000 CLV
- 10% monthly churn drops CLV to $1,000
- 15% monthly churn reduces CLV to $667
A 5% improvement in retention can boost profits by 25-95%. This explains why retention needs priority attention in any customer lifetime value calculation formula.
Product Stickiness and Engagement
Product stickiness shows how often customers return to your product. This creates usage habits that build stronger relationships over time. SaaS companies measure stickiness using the DAU/MAU ratio (daily active users divided by monthly active users).
SaaS products have an average DAU/MAU ratio of 13%. Users typically use the product about four days monthly. Higher stickiness associates with:
- Lower churn through built-in usage habits
- Higher value through subscription renewals
- Stronger customer loyalty despite competitors
Features that save customers’ time or money, add convenience, or make workflows better naturally improve stickiness and extend lifetime value.
How to Improve SaaS Customer Lifetime Value
Growing your SaaS customer lifetime value needs strategic approaches that work across many business areas. Your existing customer relationships can generate maximum revenue if you focus on these proven methods.
Increase ARPU through upsells and pricing
Tiered pricing creates natural upgrade paths that boost average revenue per user. Studies show 70-95% of SaaS revenue comes from upsells and renewals. Setting prices too low can suppress ARPU and slow down future growth.
You should think about putting in place usage-based pricing to scale revenue as your customer base grows. This approach works best for analytics, developer tools, and infrastructure solutions. Your ARPU will improve when you cut down on excessive discounts and remove outdated pricing.
Reduce churn with better support and onboarding
Great onboarding makes a huge difference in retention, 86% of users stay loyal when they receive onboarding and ongoing education. Customers often leave simply because they miss the value you want them to see.
Product education initiatives like training and guided tutorials help customers grasp your product’s value. A skilled team providing support across all channels builds strong, lasting relationships. Customized onboarding makes a difference research shows it can cut churn by 14.7%.
Use cohort analysis to identify high-value segments
Cohort analysis helps you move from broad guesses to targeted actions by showing exactly when and why customers leave. You can spot groups with unusually high LTV like customers who come through referrals or users who finish setup within 24 hours.
This approach naturally groups customers by time, behavior, or predicted value. To cite an instance, you might find that customers from discount campaigns tend to leave earlier than others, so you can support them differently.
Interview loyal customers to find retention drivers
One-on-one talks with happy customers give you raw, detailed feedback that numbers alone can’t show. These conversations light up the emotional reasons behind loyalty and retention.
Smart questions help you understand deeper experiences and pain points. You can learn what would have made their onboarding better or when they felt most supported. These insights help you customize communication, suggest better solutions, and adjust your approach based on each customer’s unique journey.
Conclusion
Customer lifetime value is the life-blood of sustainable growth for any SaaS business. This piece explores how a clear understanding of LTV strengthens your decision-making process and ended up driving profitability.
The ideal LTV:CAC ratio of 3:1 provides a clear standard for success. Your customers should generate at least three times more value than your acquisition costs. This balance needs careful attention to both sides of the equation.
Monthly Recurring Revenue, Average Revenue Per User, and churn rate give actionable insights into your customer relationships. Small improvements in these areas produce substantial results. Note that reducing churn by just 5% can boost profits between 25% to 95%.
Your growth plans should prioritize strategies that improve customer lifetime value. Tiered pricing structures create natural upgrade paths. Tailored onboarding experiences reduce customer dropout substantially. Cohort analysis identifies your most valuable customer segments and allows targeted retention efforts where they matter most.
Customer interviews are a great way to get insights that analytics alone cannot provide. Direct conversations with loyal customers reveal the emotional drivers behind their continued business. This information helps create more meaningful engagement strategies.
Understanding how to calculate customer lifetime value changes your approach to business growth. Your focus shifts from chasing new customers at high costs to building a model that maximizes value from existing relationships. This all-encompassing approach creates healthier unit economics, stronger valuation potential, and a sustainable competitive advantage.
These strategies can help your SaaS business thrive through better customer relationships and increased efficiency over time. The trip toward optimized LTV starts with understanding its components and leads to a business model built for long-term success.
Key Takeaways
Master these essential insights to calculate and optimize customer lifetime value for sustainable SaaS growth:
• Maintain a 3:1 LTV:CAC ratio – Your customers should generate at least three times more revenue than acquisition costs for healthy unit economics.
• Use the churn-based formula: ARPU ÷ Churn Rate – This simple calculation provides accurate LTV estimates using readily available metrics.
• Focus on retention over acquisition – Reducing churn by just 5% can boost profits by 25-95%, making retention investments highly profitable.
• Implement tiered pricing and personalized onboarding – These strategies naturally increase ARPU while reducing early-stage churn through better customer success.
• Leverage cohort analysis to identify high-value segments – Understanding which customer groups deliver the highest LTV enables targeted retention and acquisition strategies.
Remember that LTV calculation isn’t just about numbers it’s about building sustainable relationships that drive long-term profitability. By monitoring these metrics consistently and implementing the optimization strategies outlined above, you’ll transform your SaaS business from constantly chasing new customers to maximizing value from existing relationships.
FAQs
Q1. How do you calculate Customer Lifetime Value (CLV) for a SaaS business? The simplest formula for calculating CLV in SaaS is ARPU (Average Revenue Per User) divided by Churn Rate. For a more accurate picture, you can use (ARPU × Gross Margin) ÷ Revenue Churn Rate. These formulas provide insights into the total revenue a customer is expected to generate over their entire relationship with your business.
Q2. What is considered a good LTV to CAC ratio for SaaS companies? A 3:1 LTV to CAC ratio is generally considered the benchmark for SaaS businesses. This means your customer’s lifetime value should be at least three times the cost of acquiring them. However, ratios can vary by industry, with some sectors seeing healthy ratios between 4:1 to 6:1.
Q3. How can SaaS businesses improve their Customer Lifetime Value? SaaS businesses can improve CLV by increasing ARPU through upsells and tiered pricing, reducing churn with better support and onboarding, using cohort analysis to identify high-value customer segments, and interviewing loyal customers to understand retention drivers. Even small improvements in retention can significantly boost overall profitability.
Q4. Why is Customer Lifetime Value important for SaaS companies? CLV is crucial for SaaS companies as it helps measure financial sustainability, informs customer acquisition strategies, and directly impacts company valuation. Understanding CLV allows businesses to make informed decisions about customer acquisition spending, product development, and long-term growth strategies.
Q5. What key metrics influence Customer Lifetime Value in SaaS? The main metrics influencing CLV in SaaS include Monthly Recurring Revenue (MRR), Average Revenue Per User (ARPU), Churn Rate, and Product Stickiness (often measured by DAU/MAU ratio). Monitoring and optimizing these metrics can lead to significant improvements in overall customer lifetime value.