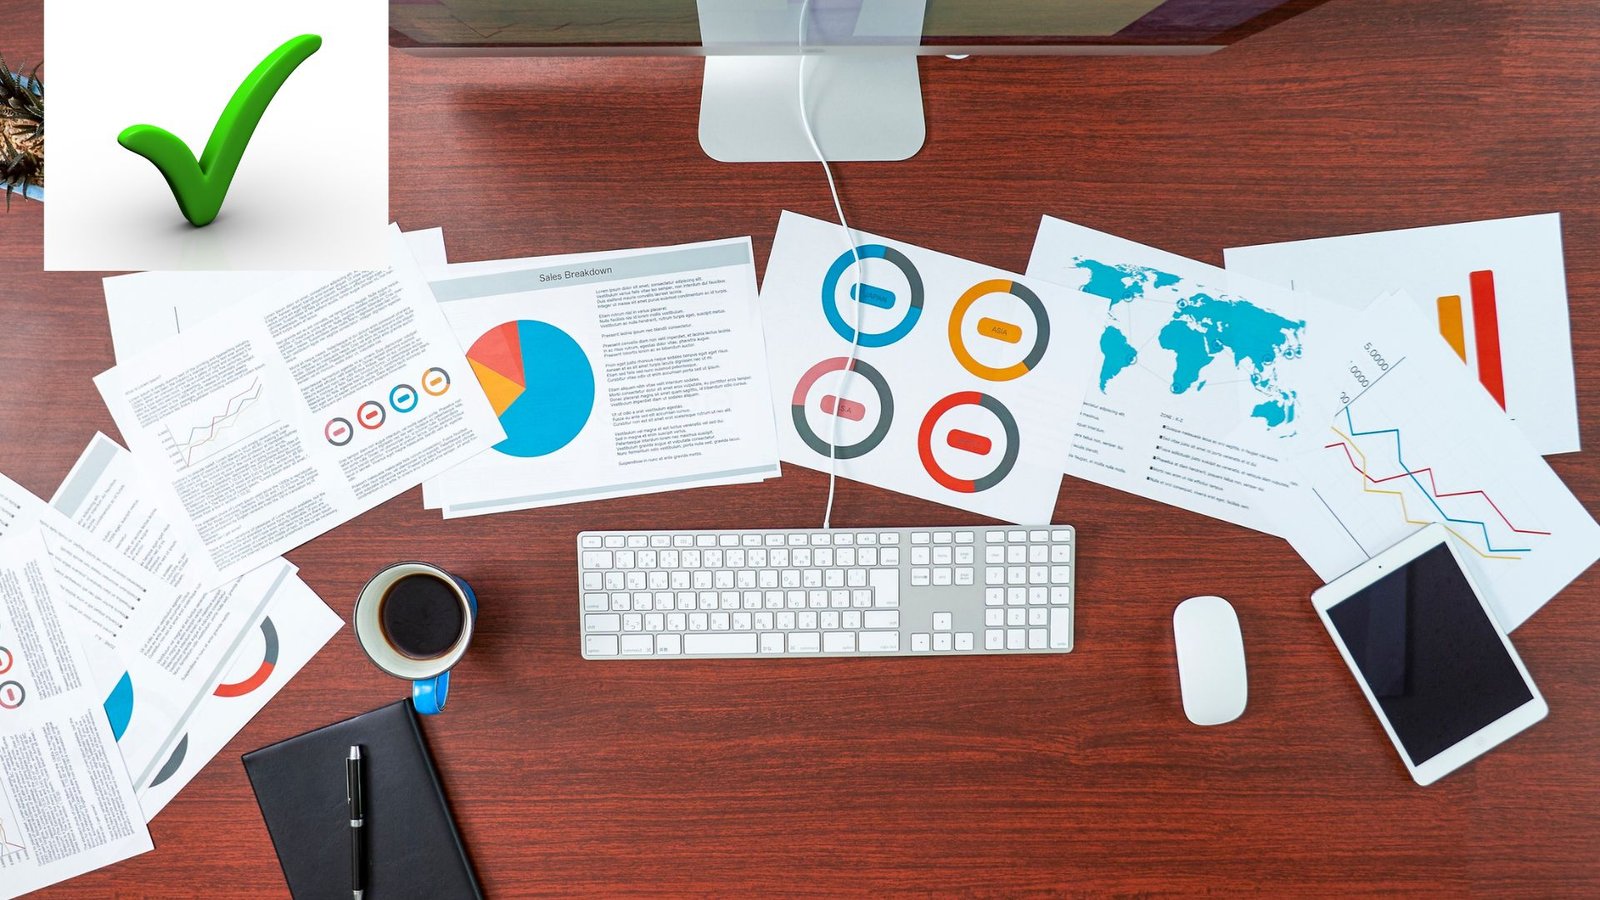
My role is to help businesses move from spreadsheets full of numbers to powerful visualizations that inspire action. Whether it’s building dashboards for executives, creating visuals that simplify massive datasets, or designing reports that speak to non-technical audiences, I make sure your data tells the right story at the right time.
The Comprehensive Data Visualization Services
- 01. Business Intelligence (BI) Modernization
- 02. Advanced Dashboard & Analytics Solutions
- 03. Customized Dashboard Creation
- 04. Advanced Visualization Techniques
- 05. Data Storytelling & Visual Narratives
Building BI without a clear direction often leads to wasted tools and half-used reports. I work with you to design a BI roadmap that aligns with your business goals. This ensures that every dashboard, data source, and metric serves a purpose.
- Define clear KPIs tied directly to business objectives
- Prioritize BI initiatives based on immediate and long-term needs
- Build a scalable roadmap that grows as your business expands
Data is only valuable if it leads to action.
I focus on developing insights that go beyond “what happened” to “what should we do next?” By combining analytics with visualization, I highlight the key performance indicators that truly matter, surface hidden trends, and connect the dots between data points.
The result is insights you can act on immediately, whether that’s adjusting a campaign, reallocating resources, or identifying a growth opportunity you didn’t see before.
Every business is different, and your dashboards should reflect that.
I create dashboards that are tailored to your goals, whether it’s monitoring sales performance, tracking customer journeys, or keeping an eye on operational efficiency.
These dashboards aren’t just pretty visuals, they’re designed to be interactive, user-friendly, and aligned with your decision-making needs. With a single glance, you and your team can spot trends, identify risks, and take action without digging through endless reports.
Sometimes a simple bar chart isn’t enough. For complex datasets, advanced visualization techniques such as heatmaps, geographic mapping, network diagrams, or predictive visuals are needed to truly uncover insights.
I specialize in applying the right technique to the right dataset, so you can see patterns that would otherwise remain hidden.
Whether it’s tracking customer behavior across regions or analyzing intricate supply chain relationships, advanced visualizations make the invisible visible and the complex easy to understand.
Data without context is just noise. Data storytelling is about weaving numbers into a narrative that resonates with your audience, whether that’s a board of directors, investors, or your internal team.
I help you present data in a way that builds a clear story:
what happened, why it matters, and what should happen next. Visual narratives ensure that your audience doesn’t just see the data, but feels its importance, remembers it, and takes action because of it.
Discuss your Data Visualization needs today
Why choosing me for your data analytics project?

Expertise Across Industries
I understand the unique challenges of different sectors and deliver solutions that fit your field.
Custom-Built Solutions
No one-size-fits-all. I create analytics tailored to your business goals.

Scalable & Secure
Whether you’re just starting with analytics or running enterprise-level operations, my solutions grow with your business.
Real-Time Efficiency
I build analytics pipelines and dashboards that deliver insights in real time, so you can act quickly, reduce risks, and seize opportunities as they happen.


