How to Master Consumer Analytics: A Step-by-Step Guide for Business Growth
 Customer experience matters just as much as products or services – at least that’s what 80% of customers believe.
Understanding what drives customer decisions and loyalty through consumer analytics has become crucial for businesses today. Companies that effectively use consumer data can boost their profitability by up to 60%, according to McKinsey. Evidence-based marketing strategies also show promising results with up to a 20% increase in ROI.
These statistics tell a compelling story. Customers want personalized interactions – 71% expect them. Brands that offer personalization see 80% higher purchase rates. The conclusion is obvious: businesses that exploit customer data analytics have a clear edge over their competitors.
Our observations show how companies make better decisions when they use data. They spot trends accurately, understand their customers better, and adapt quickly to market shifts. Webfleet Solutions proves this point perfectly. They used analytics tools to create a consistent customer experience across Europe. The result? They made faster decisions and launched 10 innovative solutions in just one year.
Let us show you how to become skilled at consumer analytics to grow your business. You’ll discover practical ways to map customer experiences, gather data, analyze insights, and take action that brings measurable results.
What is Consumer Analytics and Why It Matters
Consumer analytics goes beyond just collecting numbers. It helps us learn how customers behave, what they like, and how they connect with your business at different points. The market today sees customer priorities changing faster. Companies must master consumer analytics to grow their business steadily.
Understanding consumer behavior analytics
Consumer behavior analytics looks at how people deal with businesses, buy things, and react to marketing. This field combines analytical insights with psychology to spot future trends and build relevant business strategies. Companies that study customer behavior learn what makes people buy and stay loyal.
The process needs different types of customer data:
Direct feedback (surveys, reviews, complaints)
Behavioral data (website browsing, purchase history, app usage)
Transactional data (frequency of purchases, timing, amount spent)
Demographic information (age, gender, location)
Psychographic data (interests, attitudes, values, lifestyle)
Organizations can spot patterns that clarify how customers make decisions by getting into this information. These insights help businesses predict customer needs and position products at the right time.

How analytics improves customer experience
Customer experience analytics turns raw data into valuable insights that boost satisfaction, involve customers, and build loyalty. Research shows businesses that focus on customer analytics see 115% higher ROI and 93% higher profits than competitors. This shows how much it affects growth.
Companies can find problems in the customer’s trip and fix issues before they grow through analytics. This method lets businesses create customized experiences. This matters because 71% of customers expect customized interactions with brands, and 76% feel frustrated when they don’t get them.
“Going into detailed analytics helps you create personalized customer experiences,” notes one industry report. “The data-oriented strategy will give each customer interaction value”. Customers who feel valued build stronger emotional bonds with brands, which leads to more loyalty and good word-of-mouth.
Key benefits for business growth
Smart use of consumer analytics brings many growth benefits. Companies can segment customers better. Instead of using simple demographics, they can group people based on real behavior, priorities, and buying patterns. This precision helps create targeted marketing that strikes a chord with specific audiences.
Analytics makes decision-making better by a lot. McKinsey research shows strong links between high customer experience ratings and revenue growth. Companies that increased satisfaction scores by at least 20% saw cross-sell rates jump 15% to 25% higher. Analytical approaches take the guesswork out of business strategy.
Predictive tools help companies spot market changes early. Businesses can see trends coming by analyzing past behaviors. They can adjust their strategies – launching products, changing prices, or updating marketing messages. This creates an edge in fast-changing markets.
Consumer analytics helps spend resources wisely. Understanding which channels bring sales and where customers leave helps make smart investments with maximum returns. This optimization cuts costs and makes the business more profitable.
Step 1: Map the Customer Journey
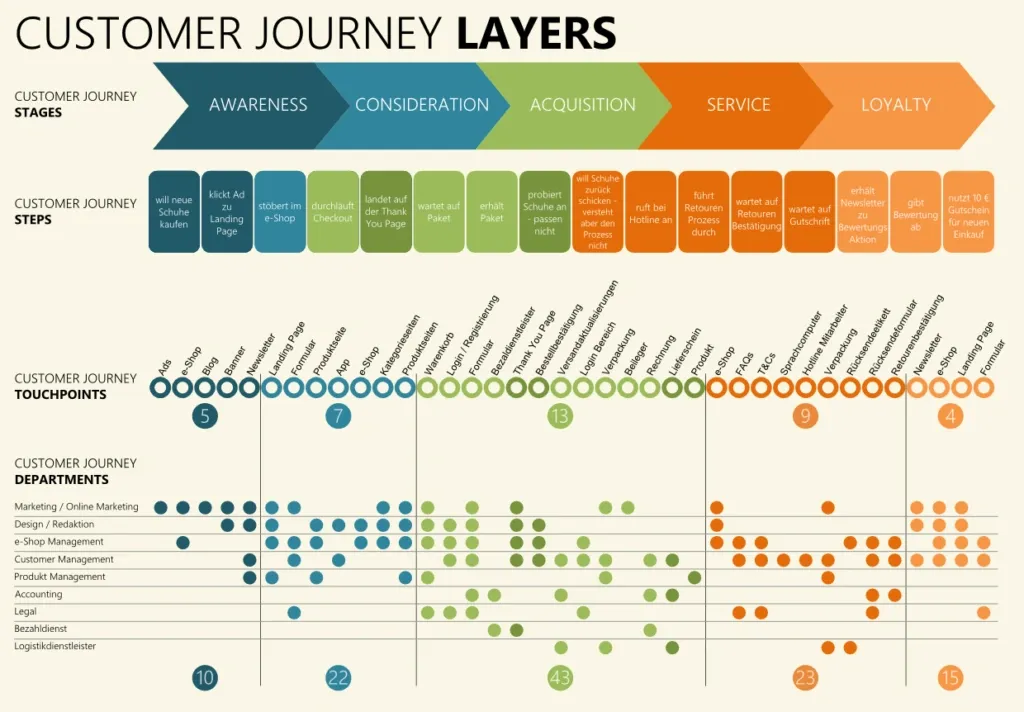
Image Source: Piwik PRO
Customer journey mapping creates the foundation of effective consumer analytics. This visual representation shows how customers interact with your brand from their original awareness through purchase and beyond. Companies that use journey mapping see a 20% increase in customer satisfaction, 15% revenue growth, and reduce service costs by up to 20%.
Identify key touchpoints and stages
Touchpoints represent moments when customers interact with your brand directly or indirectly. These interactions shape perceptions, influence decisions, and determine satisfaction levels. The process of identifying these moments starts here:
Your customer’s journey breaks down into three main phases:
Pre-purchase: Social media, website visits, ads, word-of-mouth, reviews, and search results
During purchase: Sales representatives, checkout processes, payment systems, and customer service
Post-purchase: Order confirmations, product delivery, support interactions, and loyalty programs
A close look at these touchpoints reveals how customers actually move through your experience not just how you think they do. The difference matters because customer journeys rarely follow a straight line. Customers switch between devices, revisit decisions, and carry expectations from previous experiences.
Understand customer motivations and pain points
Customer decisions stem from more than surface behaviors. Pain points, specific challenges customers face during brand interactions fall into four main categories:
Financial (looking for economical solutions)
Productivity (needing to optimize time and effort)
Process (struggling with complicated interfaces or procedures)
Support (needing timely, empathetic assistance)
Surveys, interviews, and direct feedback help identify these factors. The collected information reveals patterns and trends. You learn about vital insights by asking questions like: “How do I choose where to buy?” or “Where do I go for assistance?”
These motivations add context to your behavioral data and turn raw metrics into analytical insights. Companies that study customer journeys can spot opportunities for cross-selling, fix service gaps, and boost conversion rates.
Line up internal teams with journey stages
Journey mapping eliminates departmental silos by building a shared understanding of customer experience. The core team members who created customer journey maps reported better alignment between internal teams 80% of the time.
Success requires these steps:
Build a diverse mapping team with frontline staff, management, and support functions
Give clear ownership for each touchpoint in the journey
Create a common vocabulary around customer experience
Share journey insights across departments to build unified strategies
Teams that collaborate this way understand what happens before and after customer interactions. This knowledge enables consistent, high-quality experiences throughout the journey. Regular reviews and updates to your journey map help teams stay focused on changing customer expectations.
A really well-mapped customer journey creates the framework you need for the next steps in your consumer analytics strategy: collecting and organizing customer data.
Step 2: Collect and Organize Customer Data
Customer data collection forms the foundation of successful consumer analytics. A study shows 85% of organizations say poor-quality data hurts their operations. Strong data collection practices have become vital for business success.
Direct vs. indirect data sources
Customer data falls into three main categories:
Direct data: Customers provide this information through surveys, feedback forms, interviews, customer support interactions, and purchase details. This feedback helps learn about customer satisfaction, priorities, and problems.
Direct data: External channels like social media comments, online reviews, contact center transcripts, and website analytics provide unsolicited feedback. These sources capture genuine customer opinions outside formal channels.
Inferred data: Analysis of customer behaviors such as website clicks, purchase history, and usage patterns reveals trends. This data shows customer preferences without asking them directly.
Companies that use these data sources together understand customer needs better. Studies show 78% of businesses using centralized data reporting saw better operational results.
Best practices for data quality and centralization
Quality data supports every successful consumer analytics strategy. Here’s how to keep data reliable:
Take a focused approach: Collect data that serves specific purposes. This simple strategy reduces complexity and helps find valuable information.
Set clear governance rules: Regular quality checks verify data accuracy, completeness, consistency, and timeliness. Written standards and reporting systems help track quality.
Keep data in one place: A unified platform combines information from all sources, creating a ‘single source of truth.’ Every department gets accurate, current information. 57% of companies using centralized reporting saw notable growth.
Follow privacy rules: Build trust by being open about data practices and following GDPR and CCPA rules. Clear communication about collection policies lets customers control their data.
Using customer data and analytics tools
Good analytics tools turn raw data into useful information:
Web analytics platforms like Google Analytics show visitor behavior, conversions, and traffic sources. These tools measure how customers interact with your site.
Customer Data Platforms (CDPs) build complete customer profiles. They collect data from many sources and use these profiles with marketing tools.
Experience intelligence platforms mix web analytics with qualitative insights. They help understand customer actions and motivations.
Customer Relationship Management (CRM) systems track customer information and interactions. They keep data accurate through verification processes.
The choice of tools matters less than their ability to centralize data, monitor quality, and provide useful insights. Smart businesses also use AI to analyze data, find patterns, and predict trends that guide strategic decisions.
Step 3: Analyze Insights to Find Opportunities
Customer data shows its true worth when analysis reveals patterns and opportunities. Companies that blend customer analytics into their operations see 126% better profits than their competitors. This makes it a vital step to accelerate business growth.
Segment customers based on behavior
Behavioral segmentation splits your customer base into groups with similar traits or behaviors. This helps create more targeted marketing campaigns. Only one-third of companies using customer segmentation find it effective. Many businesses miss opportunities because they don’t segment their customers properly.
Your segmentation should go beyond demographics and look at deeper behavior patterns:
Behavioral factors: Purchase habits, brand loyalty, usage rates, benefits sought
Psychographic elements: Lifestyle, values, interests, aspirations
Psychographic elements: Lifestyle, values, interests, aspirations
Lifecycle stage: Your customer’s position in their brand relationship
The RFM (Recency, Frequency, Monetary Value) model works really well. It measures the last purchase date, buying frequency, and spending amounts. This helps you identify your most valuable customers, those with high lifetime value and brand loyalty.
Spot patterns and root causes
Understanding patterns needs both numbers and customer feedback. Look at common themes across customer groups by asking specific questions: How do different segments find your brand? What times show peak purchasing? Where do customers get stuck?
Root cause analysis (RCA) helps you learn about underlying issues instead of just fixing symptoms. The “5 Whys” technique involves asking why something happens repeatedly until you find the real cause. Fishbone diagrams give you a visual map of cause and effect. They show potential causes through category branches.
Data visualization tools help you see complex patterns clearly. Pareto analysis (the 80/20 rule) puts problems in order from biggest to smallest. This shows which areas will give you the best results when fixed.
Use predictive models to forecast trends
Predictive analytics uses AI and machine learning to process big data sets and spot patterns human analysts might miss. These models can predict future consumer behavior accurately. They find connections between different behavior patterns.
Looking at past data helps businesses spot upcoming trends that will likely continue. This helps them prepare for changes in customer priorities before sales numbers show it. A retailer might use predictive analytics to know which products will sell well during holidays.
AI-powered predictions help businesses in many ways. They can optimize inventory and pricing strategies and create personalized marketing that matches individual customer preferences. These informed insights help companies alleviate potential risks before they grow, leading to better decisions.
Step 4: Act on Insights and Iterate
Successful analytics programs take insights and turn them into action, which sets them apart from programs that just collect data. Customer analytics evolves from a simple report into a decision engine that keeps improving business results.
Prioritize high-impact improvements
Your team needs a systematic approach to identify improvements that deliver maximum value with minimal investment. Here are some effective methods to think about:
Pareto analysis: This technique applies the 80/20 principle. You can achieve 80% of the gains by fixing 20% of the issues. Group initiatives that tackle similar problems, score them based on impact, and focus on the top 20% of your highest-scored initiatives.
Impact/effort matrix: Plot potential improvements on a matrix based on business impact versus implementation effort. This visual tool helps you spot:
Quick wins (high impact, low effort)
Strategic initiatives (high impact, high effort)
Low-priority items (low impact)
Leading brands use AI-powered text and speech analytics to analyze unstructured data from customer interactions. This technology automatically assigns impact scores to identify top experience drivers.
Cooperate across teams for execution
Cross-team cooperation will give you meaningful results from your insights. Teams typically need:
A governance structure that holds them accountable for implementing insights
Clear ownership for each initiative
Centralized communication platforms for all team interactions
Research shows organizations must formalize cooperation processes, especially with remote or global teams. Teams can interact better through:
Topic-focused Slack channels
Regular learning sessions to share insights
Monthly updates with specific action items
Cross-team cooperation needs ongoing measurement and refinement.
Track performance and refine strategies
Regular monitoring and adaptation enable continuous improvement. Your systems should include:
Regular progress reviews using available dashboards
Impact evaluation of implemented changes
Stakeholder feedback collection to guide the next cycle
Each iteration should improve your product or service. Organizations that adopt this approach can spot risks early, make data-driven adjustments, and adapt to changing customer needs.
Feedback loops help refine your strategy based on customer behavior. This creates a culture that values and acts on customer analytics.
Conclusion
Consumer analytics has amazing potential to help businesses grow sustainably. Companies that use informed decision-making perform better than their competitors. Statistics show they achieve up to 60% higher profitability and 20% increased ROI.
A powerful framework emerges when businesses turn raw customer data into practical insights through four key steps. Mapping customer touchpoints builds a solid foundation to understand interactions. Quality data collection and organization will give a reliable base to power analytics work. Analysis of these insights shows hidden patterns, segments, and opportunities. The cycle becomes complete when you take decisive action on these findings and keep improving your approach.
Note that consumer analytics isn’t just a single project – it’s an ongoing process. Customer priorities change faster, which means you need to adapt constantly. The most successful companies build a culture where data guides every decision from product development to marketing strategies and customer service improvements.
Start small by focusing on specific business questions you want to answer. You can expand your analytics capabilities as your team builds experience. The journey to become skilled at analytics takes time, but each step improves customer experiences and business results.
The business world has moved toward putting customers first. Companies that know their customers best will succeed while others fight to stay relevant. Your dedication to become skilled at consumer analytics determines if you’ll lead your market or just participate in it.
Key Takeaways
Master consumer analytics through a systematic four-step approach that transforms customer data into actionable business growth strategies.
• Map customer journeys first – Identify all touchpoints across pre-purchase, purchase, and post-purchase stages to understand the complete customer experience.
• Prioritize data quality over quantity – Focus on collecting relevant, accurate data from direct, indirect, and inferred sources while maintaining centralized storage systems.
• Segment customers by behavior, not demographics – Use RFM analysis and behavioral patterns to create meaningful customer groups that drive targeted marketing efforts.
• Turn insights into action through cross-team collaboration – Use impact/effort matrices to prioritize improvements and establish clear ownership for implementing data-driven changes.
• Embrace continuous iteration – Set up feedback loops and regular performance reviews to refine strategies based on evolving customer needs and market conditions.
Companies implementing these consumer analytics practices see up to 60% higher profitability and 20% increased ROI compared to competitors. The key is treating analytics as an ongoing process rather than a one-time project, building a culture where customer data informs every business decision from product development to marketing strategy.

FAQs
Q1. How can consumer analytics drive business growth? Consumer analytics can significantly boost business growth by helping companies identify new revenue streams, improve customer satisfaction, optimize marketing strategies, and enhance product development. By leveraging data-driven insights, businesses can increase profitability by up to 60% and see a 20% increase in ROI.
Q2. What are the key steps to implement consumer analytics effectively? The key steps to implement consumer analytics effectively include mapping the customer journey, collecting and organizing quality data, analyzing insights to find opportunities, and acting on those insights through cross-team collaboration. It’s crucial to treat analytics as an ongoing process, continuously refining strategies based on evolving customer needs.
Q3. How does customer segmentation contribute to better marketing? Customer segmentation based on behavior rather than just demographics allows for more targeted and effective marketing efforts. Using methods like RFM (Recency, Frequency, Monetary Value) analysis helps identify the most valuable customer segments, enabling businesses to tailor their marketing strategies and improve customer engagement.
Q4. What role does data quality play in consumer analytics? Data quality is crucial in consumer analytics. Businesses should focus on collecting relevant, accurate data from direct, indirect, and inferred sources while maintaining centralized storage systems. High-quality data ensures that insights are reliable and actionable, leading to better decision-making and improved business outcomes.
Q5. How can businesses turn consumer analytics insights into action? To turn insights into action, businesses should prioritize high-impact improvements using tools like impact/effort matrices. Cross-team collaboration is essential for implementing changes effectively. Setting up feedback loops and regular performance reviews helps refine strategies based on data-driven insights, creating a culture where customer data informs every business decision.